Infrastructure Layer
Complete infrastructure control
Projects, clusters, and cloud providers
Northflank manages your entire infrastructure lifecycle—from provisioning cloud resources and Kubernetes clusters to configuring networks and integrations. Define everything in code or self-service through the UI.
Organize workloads into projects that map to Kubernetes namespaces. Deploy across multiple regions and cloud providers. Connect your own cloud accounts (BYOC) or use Northflank’s managed infrastructure.
Project organization
Group services, databases, and jobs into projects. Projects map to Kubernetes namespaces with isolated networking and resource quotas. Organize by application, team, or environment.Multi-region deployment
Deploy workloads to specific regions for low latency and data residency. Northflank provides regions in North America, Europe, and Asia-Pacific. Choose regions per project or cluster.BYOC providers
Connect AWS, GCP, Azure, or Civo cloud accounts. Northflank provisions and manages Kubernetes clusters within your infrastructure. Retain full control over cloud resources, networking, and billing.Kubernetes cluster lifecycle
Northflank handles cluster provisioning, upgrades, scaling, and maintenance. Automatic version updates with configurable maintenance windows. Import existing clusters (BYOK) from any provider.Cluster configuration
Configure node pools, machine types, autoscaling policies, and network settings. Define infrastructure requirements per cluster. Support for ARM and x86 architectures, GPUs, and specialized hardware.Infrastructure as code
Define clusters, projects, integrations, and configuration in JSON templates. Store infrastructure definitions in Git. Changes sync bi-directionally between code and the platform.Integrations and registries
Connect version control and container registries
Link Git repositories for automated builds and GitOps workflows. Configure private container registries for pulling and pushing images. All integrations available via UI, API, or infrastructure templates.
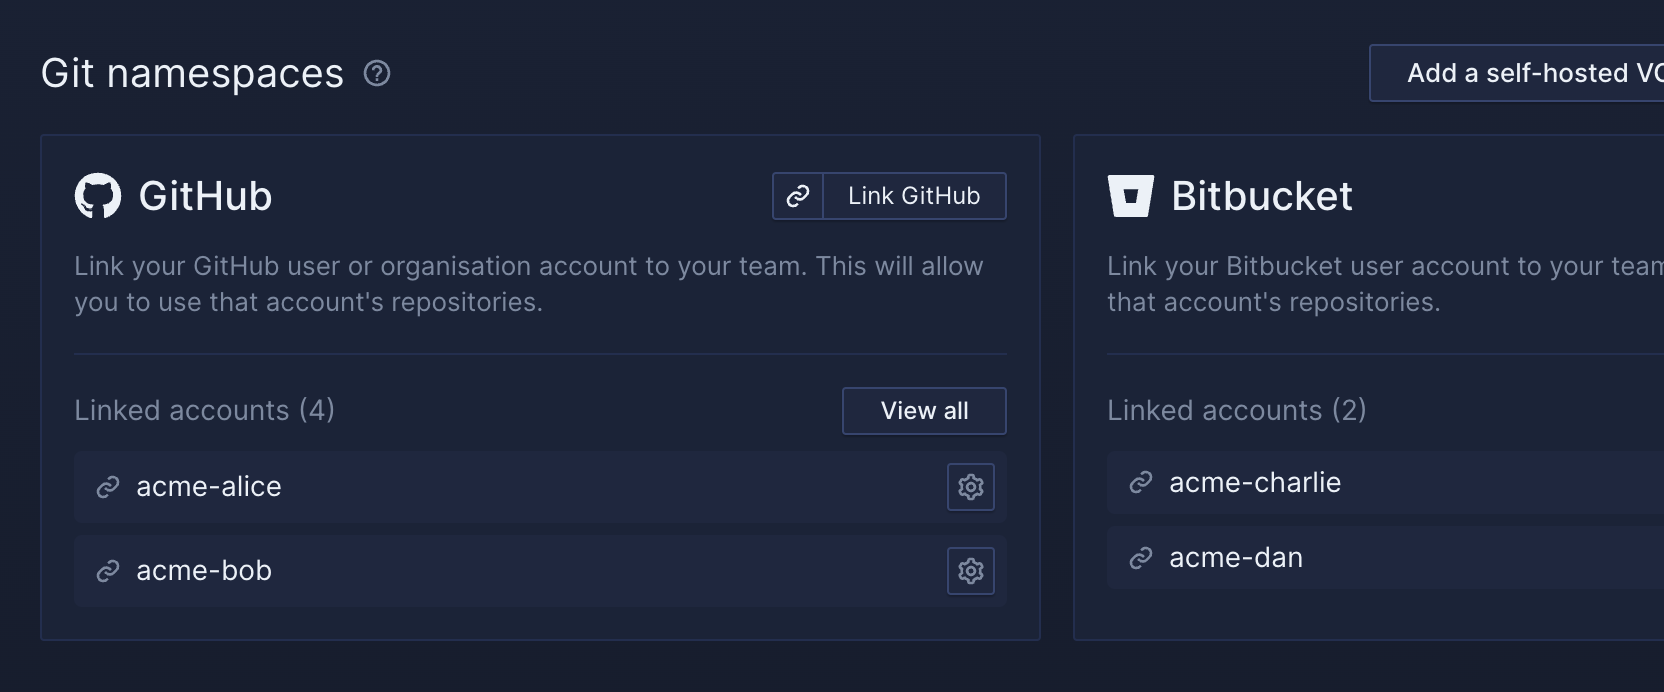
Version control integration
Connect GitHub, GitLab, and Bitbucket organizations. OAuth authentication for cloud-hosted services. Support for GitHub Enterprise, GitLab CE/EE, and self-hosted Bitbucket Server.Private image registries
Configure Docker Hub, GitHub Container Registry, GitLab Registry, Amazon ECR, Google Artifact Registry, Azure Container Registry, or custom registries. Credentials encrypted and securely stored.Infrastructure templates
Define VCS and registry integrations in templates. Reuse connection configurations across projects. Manage credentials separately from infrastructure definitions for security.Security and isolation
Secure multi-tenancy with microVMs and gVisor
Northflank implements multiple isolation layers for secure multi-tenant infrastructure. Workloads run in sandboxed environments with strict resource boundaries, network policies, and namespace isolation.
Sandboxed execution
Workloads run in microVMs via Kata Containers or gVisor for VM-grade isolation. Each container gets its own kernel, preventing host and cross-tenant access. Complete runtime, network, and storage isolation.Network isolation
Service mesh with mutual TLS encryption between workloads. Network policies enforce project-level boundaries. Private networking prevents unauthorized cross-project communication.Namespace boundaries
Projects map to Kubernetes namespaces with resource quotas and limits. RBAC policies enforce access controls at namespace level. Complete separation between projects on shared clusters.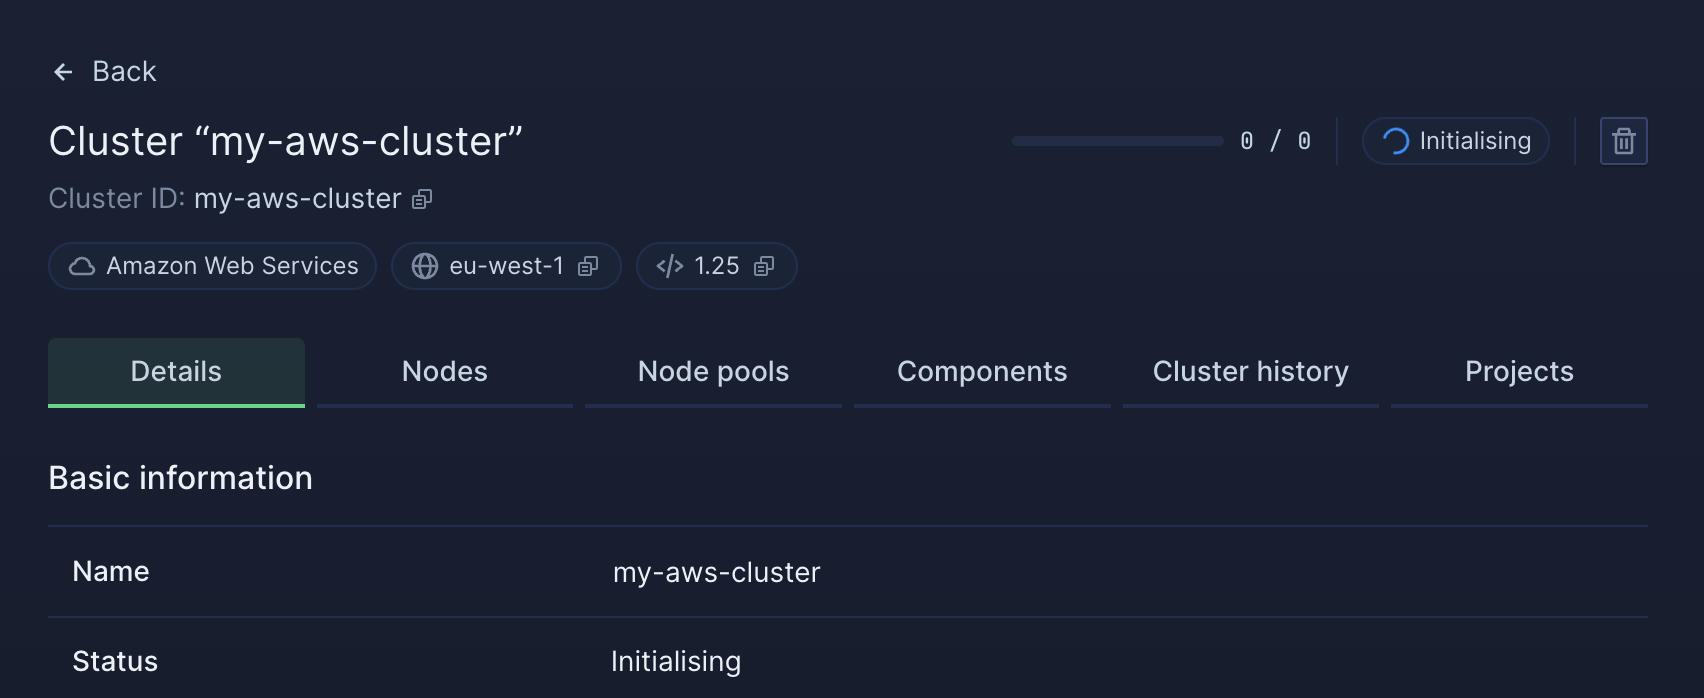
Resilience and recovery
Disaster recovery and backup management
Automated backup systems for stateful workloads with configurable retention policies. Point-in-time recovery for databases. Cross-region replication and failover capabilities for high availability.
Automated backups
Scheduled backups for all managed databases with configurable frequency and retention. Automatic backup before destructive operations. Manual snapshot creation for important milestones.Point-in-time recovery
Restore databases to any point within the retention window. Continuous backup of transaction logs. Recovery to specific timestamps for precise rollback.Cross-region replication
Replicate stateful workloads across multiple regions for disaster recovery. Automated failover to secondary regions. Configure recovery time objectives (RTO) and recovery point objectives (RPO).Monitoring and observability
Real-time logs, metrics, and alerting
Centralized logging and metrics for all infrastructure components. Real-time log streaming with 60-day retention. Configurable alerts for resource usage, health checks, and platform events.
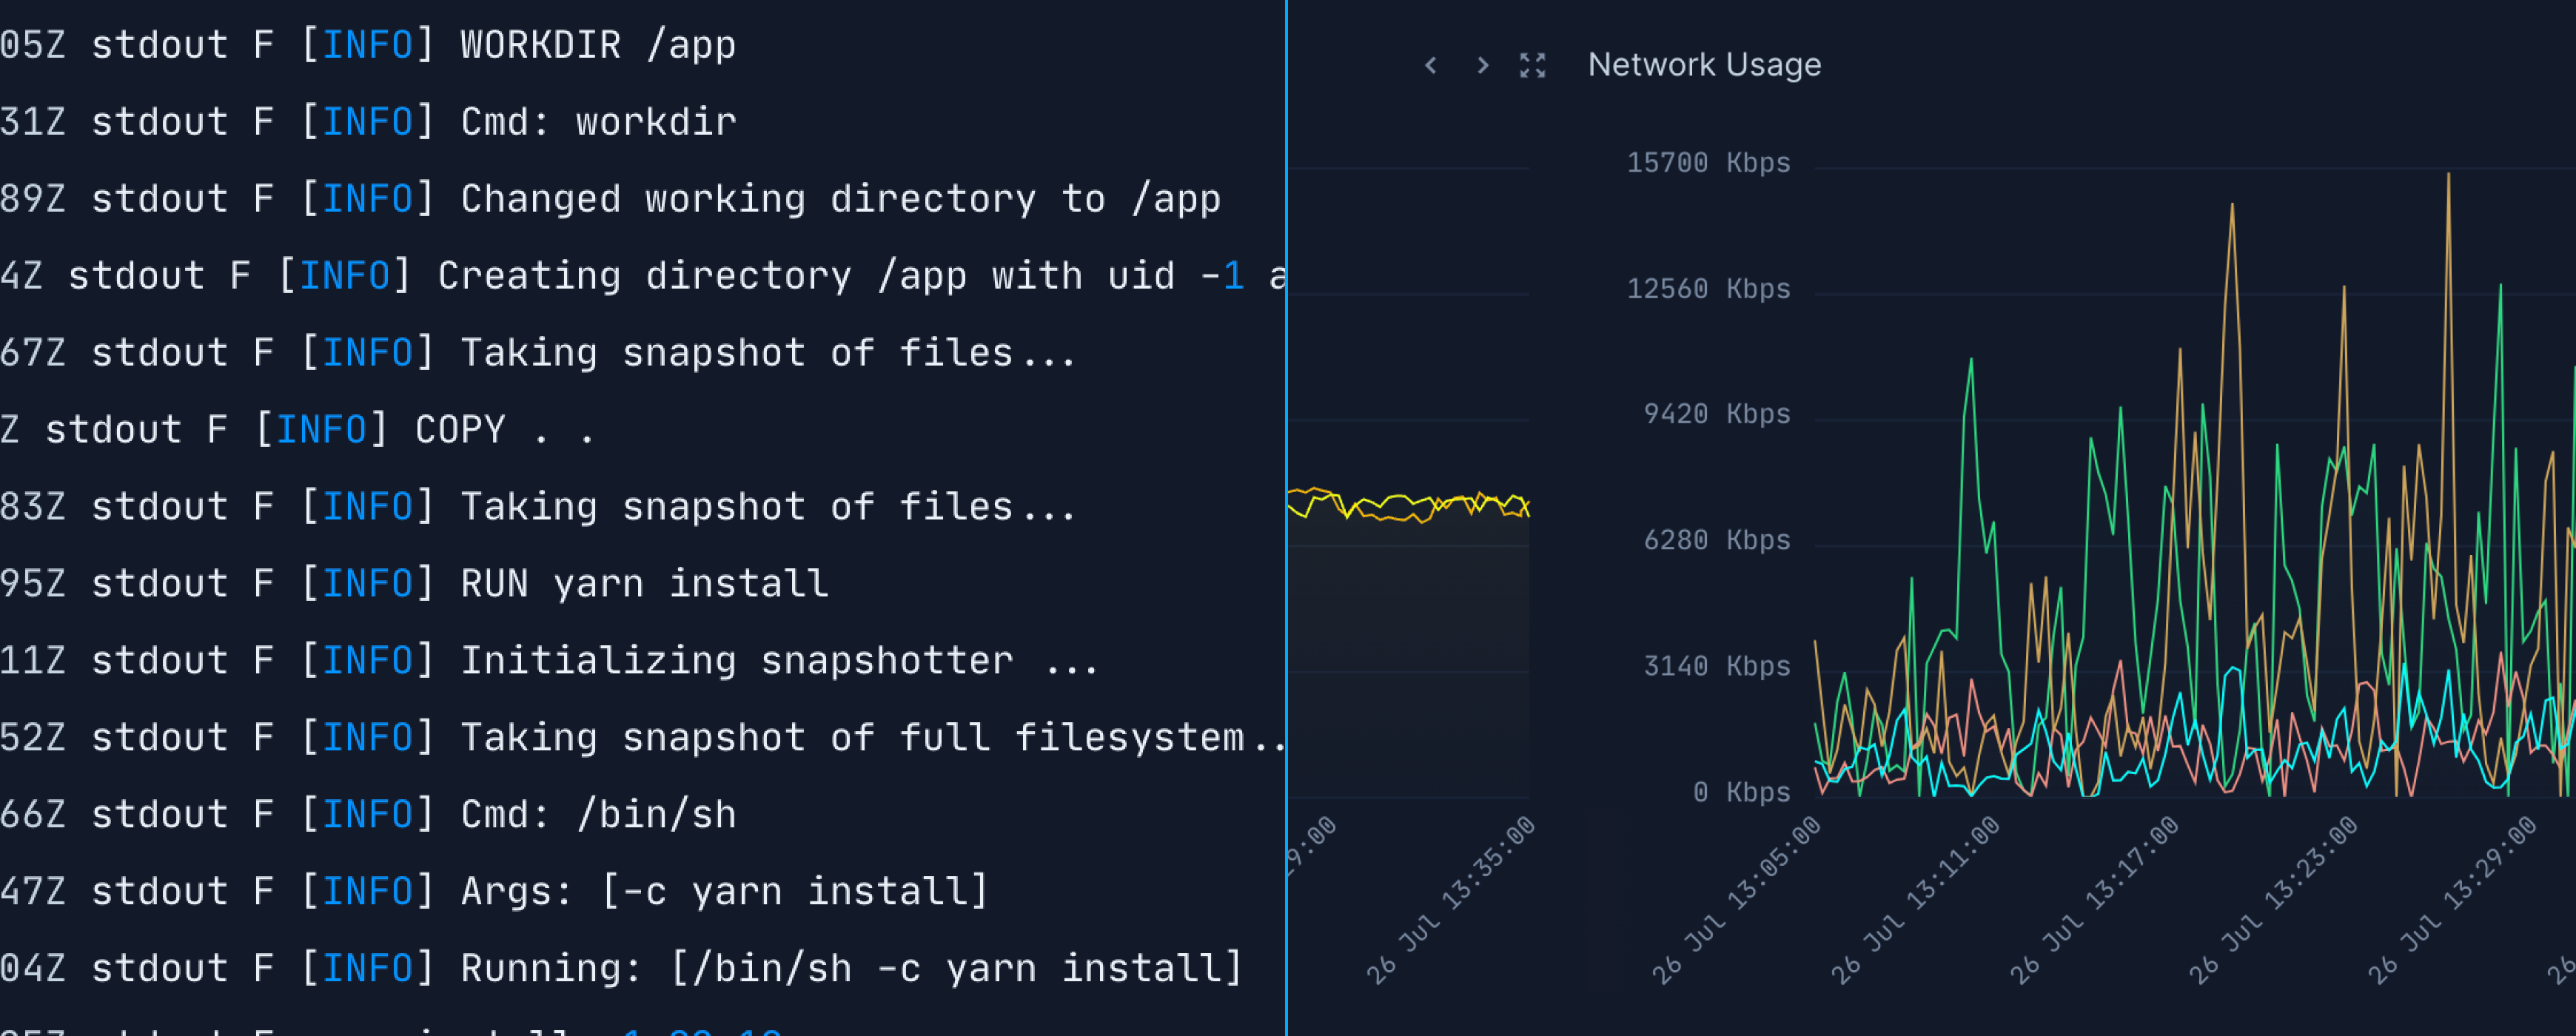
Real-time log tailing
Stream logs from services, jobs, builds, and infrastructure components in real-time. Filter by resource, time range, or log level. WebSocket-based streaming for instant updates.Infrastructure metrics
CPU, memory, disk, and network metrics for all workloads and cluster nodes. Built-in dashboards and charts. Export metrics to Prometheus, Datadog, or custom monitoring systems.60-day retention
Logs and metrics stored for 60 days with full searchability. Query historical data via API or UI. Export data for long-term archival or compliance requirements.Log forwarding
Forward logs to external platforms like Datadog, Splunk, or New Relic. Filter logs before forwarding to reduce costs. Configure per-project or account-wide log sinks.Logs and metrics API
Query logs and metrics programmatically via HTTP and WebSocket APIs. Integrate with custom dashboards, alerting systems, or data pipelines. Full API parity with UI features.Infrastructure alerts
Platform and resource monitoring
Configure alerts for infrastructure events, resource usage thresholds, and platform activities. Notifications delivered via Slack, Discord, webhooks, or Microsoft Teams.
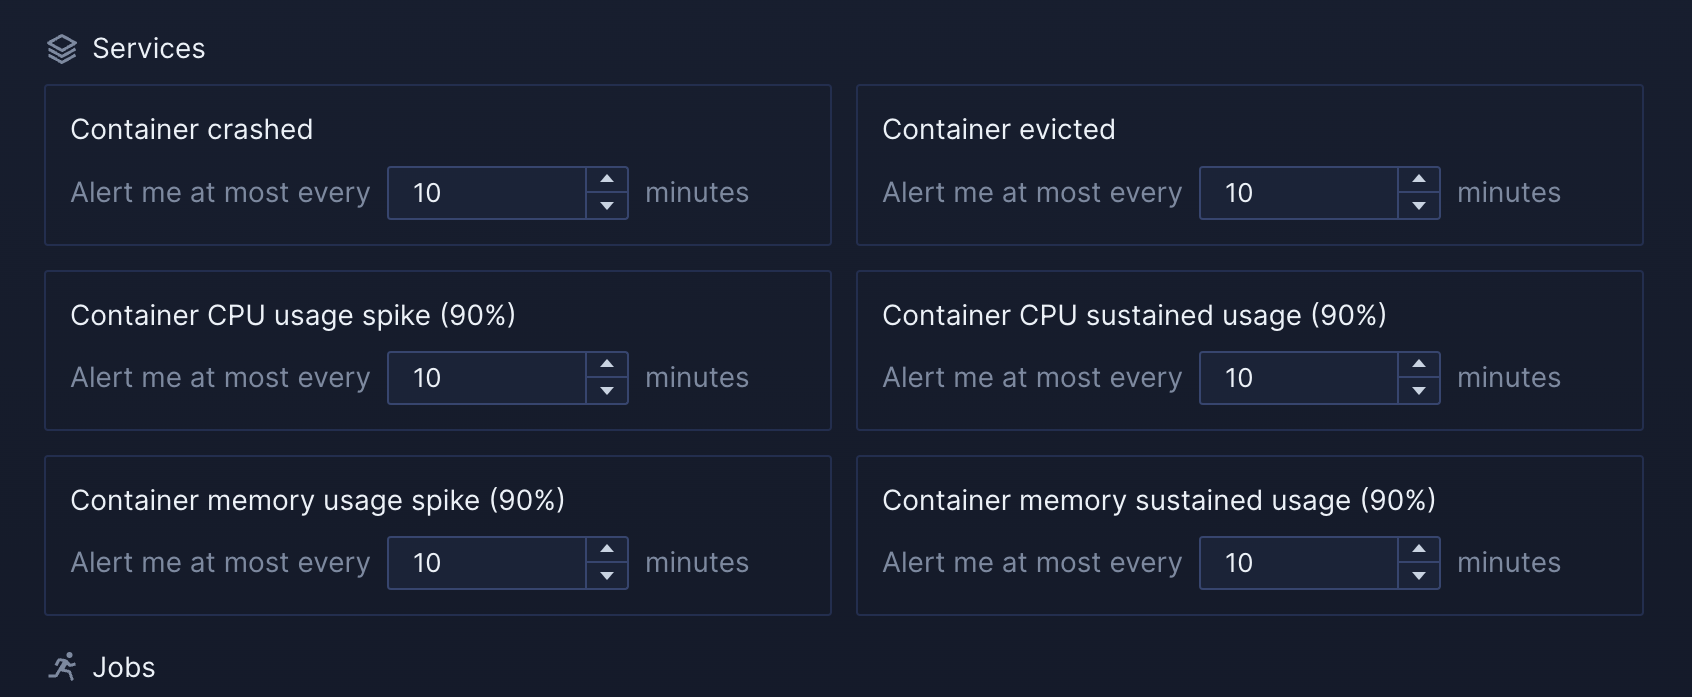
Resource usage alerts
Alert when CPU, memory, disk, or network usage exceeds thresholds. Configure per-service or cluster-wide monitoring. Multiple threshold levels for warning and critical states.Platform event notifications
Receive notifications for builds, deployments, backup completions, job runs, and autoscaling events. Alert on failures, successes, or both. Filter events by project or resource type.Integration channels
Send alerts to Slack channels, Discord servers, custom webhooks, or Microsoft Teams. Configure multiple notification channels per alert. Route different alert types to different channels.High availability
Health checks and automatic recovery
Configure readiness, liveness, and startup probes to ensure service availability. Automatic container restarts on health check failures. Zero-downtime deployments with health validation.
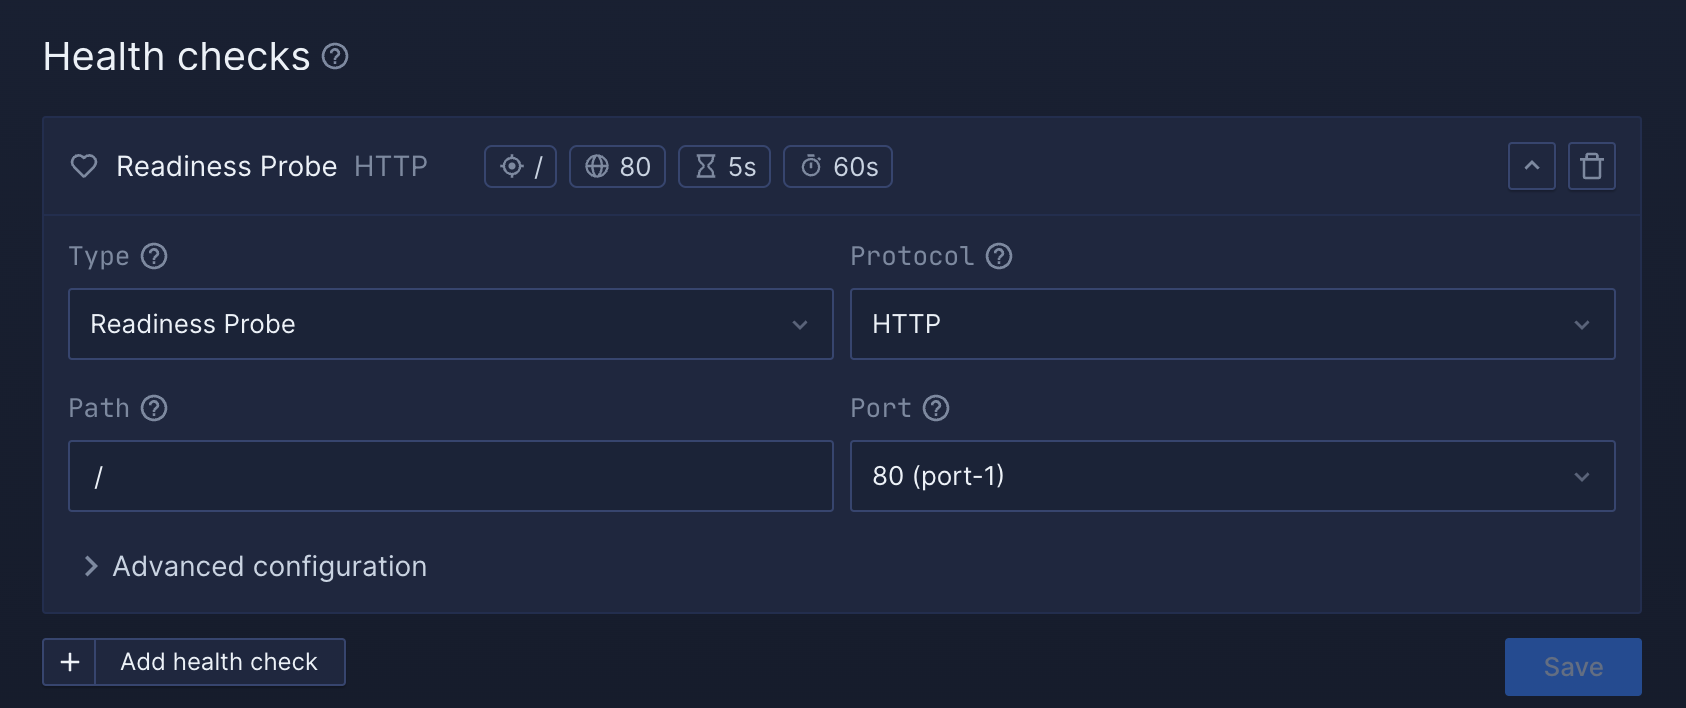
Readiness probes
Test whether containers can receive traffic after initialization. HTTP, TCP, or command-based checks. Traffic routed only to healthy containers.Liveness probes
Monitor running containers for failures. Automatic container restart when liveness checks fail. Configurable failure thresholds and timeout periods.Startup probes
Delay liveness and readiness checks until container initialization completes. Prevent premature health check failures during slow startup. Configure longer timeouts for initialization.Health monitoring
Dashboard showing health status for all services. Historical health check data and failure patterns. Alerts triggered on repeated health check failures.Infrastructure as code
OpenTofu and template-driven infrastructure
Define infrastructure using Northflank templates or integrate OpenTofu for advanced infrastructure provisioning. Templates support composition, variables, and version control for repeatable infrastructure.
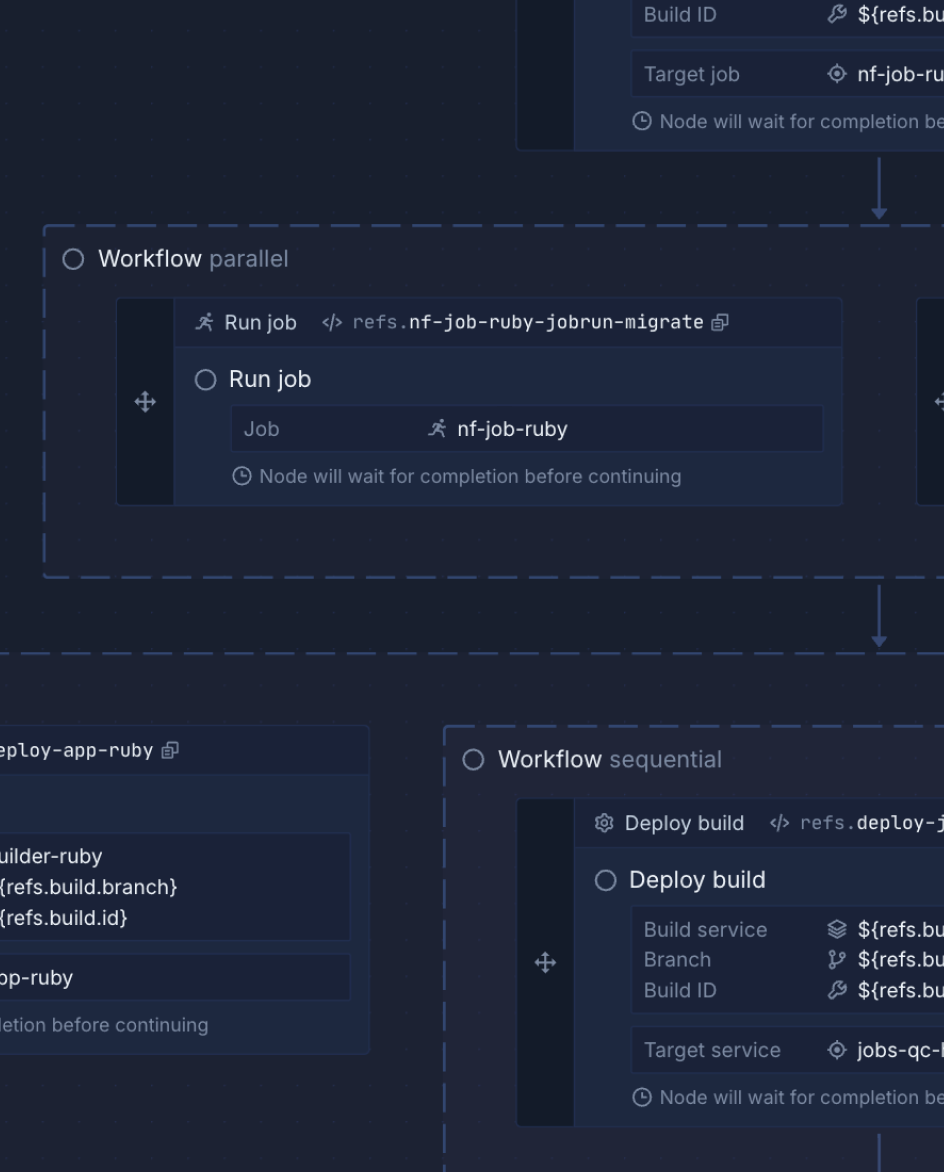
Northflank templates
JSON-based templates for defining projects, services, databases, jobs, integrations, and configuration. Compose multiple templates into complete environments. Variables and conditionals for flexibility.OpenTofu integration
Use OpenTofu nodes in Northflank templates to provision cloud resources. Combine Northflank-managed Kubernetes workloads with custom infrastructure. Execute Tofu plans during deployments.Version-controlled infrastructure
Store templates in Git repositories with bi-directional sync. Track infrastructure changes with commit history. Review infrastructure modifications via pull requests.Template composition
Reference and reuse templates across projects. Override variables for environment-specific configuration. Build libraries of reusable infrastructure patterns.Enterprise governance
RBAC, audit logs, and access control
Enterprise-grade security and governance for infrastructure management. Fine-grained role-based access control, complete audit trails, and compliance reporting. Control who can provision infrastructure, modify clusters, or access production environments.
Role-based access control
Granular permissions for infrastructure operations. Define custom roles for cluster management, project creation, integration configuration, and resource provisioning. Assign roles at team or project level.Complete audit logs
Track all infrastructure changes with detailed audit trails. Log cluster modifications, integration updates, configuration changes, and access events. Export logs for compliance and security analysis.Self-service with guardrails
Enable developer self-service while maintaining governance. Define what resources teams can provision and in which regions. Set resource quotas and spending limits per project or team.Features
Developer experience
Developer experience
- Choice of UI, CLI, APIs & GitOps
- Runs on AWS, GCP, Azure, Oracle
- Build re-useable templates
Polyglot platform
Polyglot platform
- Run any language or framework
- All envs, from preview to production
- Works with GitHub, GitLab and Bitbucket
Run your AI
Run your AI
- Scale GPUs across clouds
- Run untrusted code at scale
- Serve your inference & models
- Support fractional GPU workloads
We fixed Kubernetes
We fixed Kubernetes
- Kubernetes-ready app platform
- Run anywhere, on any Kubernetes cluster, on any cloud
- EKS, GKE, AKS, Rancher, OpenShift, Tanzu ready
