← Back to Changelog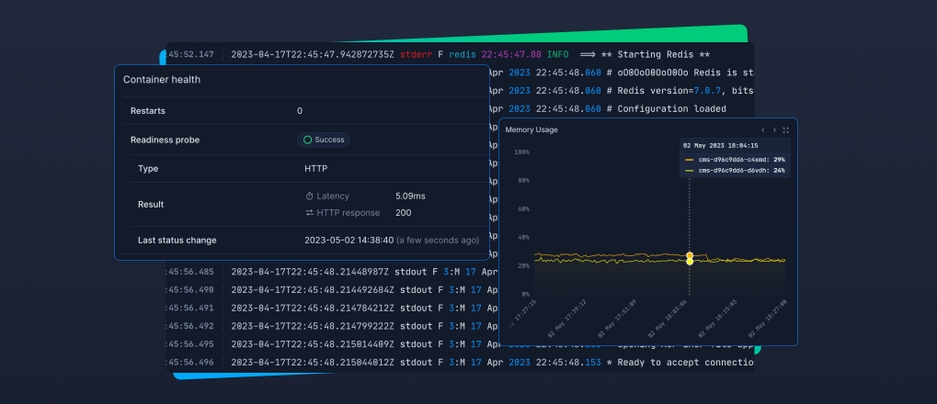
5th May 2023
Enhanced Container Observability: Metrics, Logs, and Health-Checks
We’re happy to announce significant enhancements to container observability on Northflank. These enhancements should make it easier to debug deployed workloads, and understand the performance of your application. Key features include: log direction toggling, custom query ranges for metrics, ability to export logs via UI, health-check visibility, and overview of all containers in a resource.
- Added new modal interface to observe a specific container or all containers in a resource
- Added instance metadata with resource states, metadata, and access to logs, metrics, health-checks, and terminal shell
- Added logs and metrics tabs for the all containers view
- Added logs, metrics, health-checks, and shell for specific container views
- Added Docker pull command to run your image builds locally

- Added health-checks tab
- Added dedicated container health page
- Now shows container failure reason if applicable, e.g. OOM
- Now shows total number of times a container has restarted (due to health check or crashes)
- Now shows active health checks with greater detail about:
- type: startup, liveness, and readiness probes
- status
- last update times
- responses (status code + message)
- response latencies

- Enhanced logs tab
- Added log direction preference: either new log lines come in at the top of the window, or new log lines come in at the bottom of the window more like a terminal
- Added log line panel when expanding a log line with additional metadata
- Added new controls to select and copy a specific range of logs
- Added ability to select a log range and export/download the logs

- Enhanced metrics tab
- Added support to query metrics for all containers on the metrics page
- Added support to query metrics for suggested or custom time intervals
- Volume usage graph for services with volumes now have the same visibility as those used in addons
- Added events timeline with support for start, terminate & restart events
- Metrics view is now customisable: metrics graphs can be resized and moved around within the grid layout

- Updated and moved container shell access UI into observability view for easy access when reviewing the logs, metrics and health of an individual container