You can monitor containers and replicas for deployments, jobs, and addons.
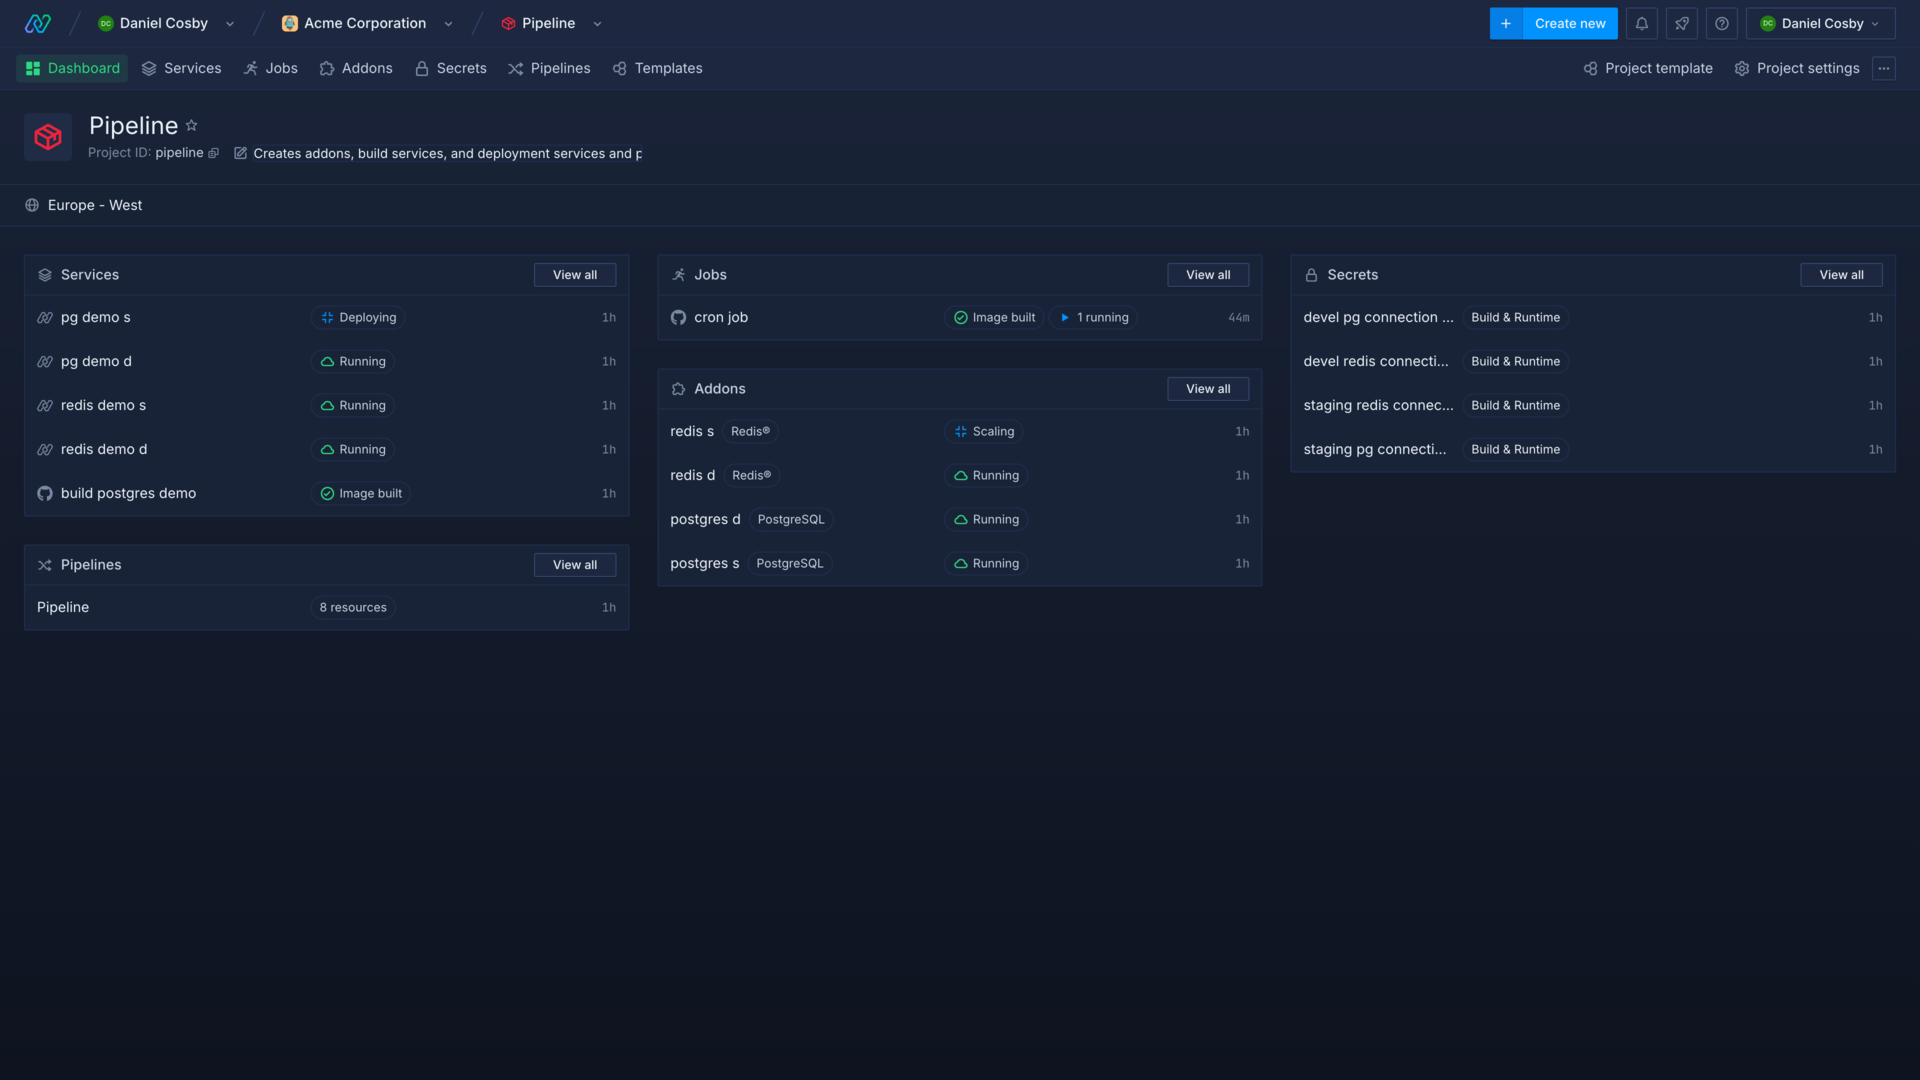
Your project dashboard shows an overview of your project's resources and their statuses.
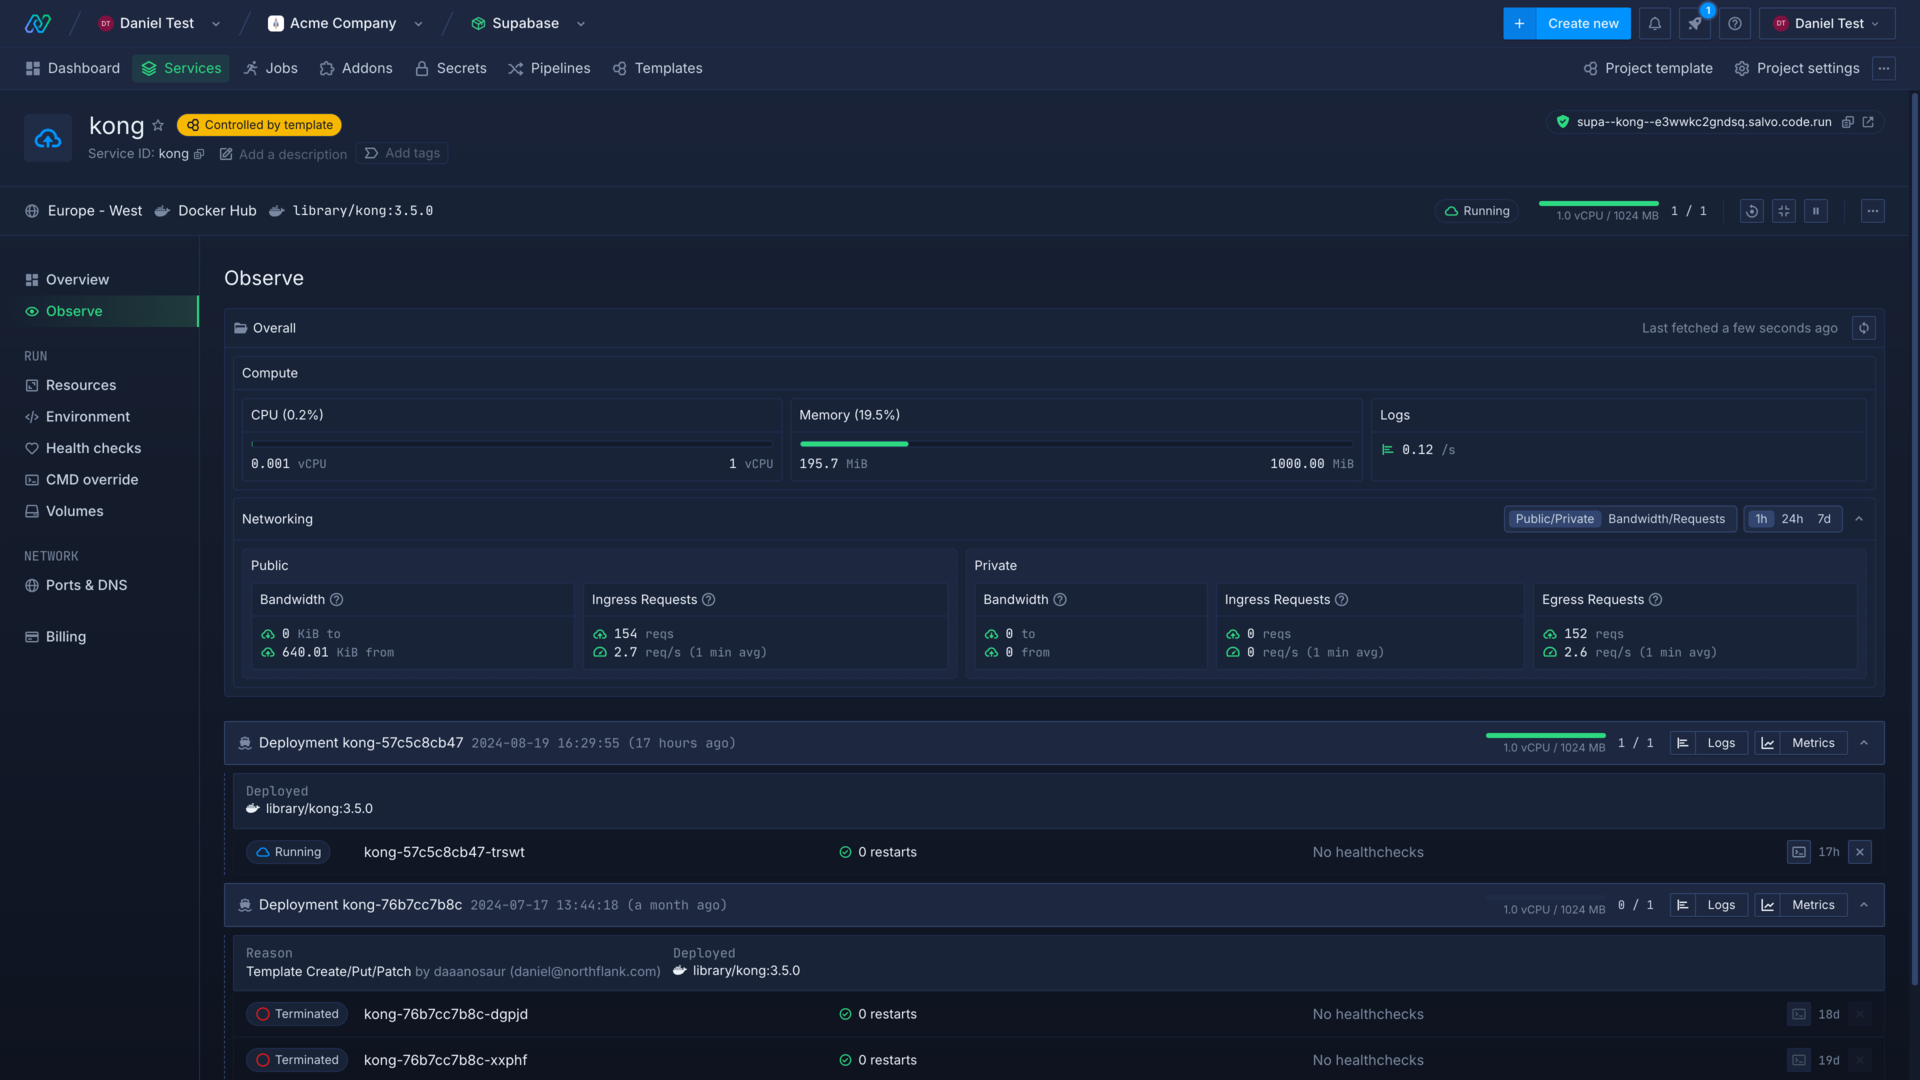
Deployments contain an observe page with combined metrics for all containers, as well as visible alerts for containers with issues.
You can click through on containers to view live, detailed logs and metrics, the status of health checks, and gain shell access (to running service or job containers).

Container statuses
Staging: the container is scheduled for deployment
Starting: the container is being deployed
Running: the container is running
Crashing: the process is crashing
Terminating: the container is scheduled to stop running
Terminated: the container has been stopped
Failed: the container has stopped because of an error
Observe deployments
You can access the observe page on deployment and combined services to see an overview of combined metrics for all running containers in the service and metadata for the deployed image. The observe page also has a list of containers, grouped by deployment.
You will be notified of any containers that require immediate intervention in a triage window.

Service metrics
The overall section contains aggregated metrics for all containers deployed in the service. Metrics are live, calculated over a rolling window of 60 seconds, and include:
- CPU: vCPU usage in millicore
- Memory: RAM usage in GiB
- Logs: number of log lines generated by containers
Network usage
You can view combined network usage for your containers, and select whether to group them by public and private networking, or by bandwidth and requests. You can also adjust the period of time to display data for, from the past 1 hour to the previous week.
Public network statistics include traffic to and from external sources, which reach your service via your service's public endpoints.
Private network statistics include traffic to and from sources from within the same project via your service's private ports, from other Northflank projects through multi-project networking, Tailscale devices, and securely-forwarded ports.
Network metrics include:
- Public bandwidth: includes traffic to external sources
- Private bandwidth: includes traffic to services with in the project, or other private networks
- Public ingress: inbound requests from the internet reaching your service via any publicly exposed endpoints
- Private ingress: inbound requests to your service's private endpoints
- Private egress: outbound requests from your service to internal and external endpoints
Deployments
The deployments list contains a history of deployments to the service. Each time a new build or image is deployed or the service is redeployed, a new deployment entry will be created. New deployments can be triggered manually, by updating environment variable, via a template or release flow, or if CD is enabled and a new image is built.
Each deployment has a unique identifier, generated from the service name, and you can view combined logs and metrics for all containers related to the current deployment. Deployments also contain the reason and user responsible for the new deployment.
Deployments have a list of active and terminated containers. You can click on container to view logs, metrics, health checks, and shell access for an individual container.
Triage
If one or more containers are reporting issues, such as failing health checks or crashing, you will be alerted in the triage window. This contains a list of containers that require intervention to bring them into a healthy state.
View addon replicas
You can view addon replicas on the containers page of your addon, which displays a list of active and terminated replicas and their statuses.
You can click through to a replica to view logs, metrics, and the health checks.
View job runs
You can view the status of job runs in the project overview, the job overview, and from the runs page of a job.
You can click through to a run on the runs page to see more detailed information, including:
- Status
- Active runs
- Failed runs
- Elapsed time
You can change the retry limit and time limit of a job if your runs are failing to complete in time, or need multiple retries to succeed.
Each job run also has a list of active and completed containers which have been deployed to run the job. You can click through to a container to view logs, metrics, health checks, and access the shell (for running containers).
Next steps
View logs
View detailed, real-time logs from builds, deployments, and more.
View metrics
View detailed, real-time metrics from builds, deployments, and more.
Configure health checks
Monitor the uptime and success of your deployed services and builds to ensure your code runs correctly and is always available.
Scale your services
Increase the resources available to your services, and the number of instances to deploy.