Northflank provides access to live and historical logs from builds, running and terminated containers, addons, and job runs.
Logs allow you to review builds and examine running containers to ensure your code is performant and without errors. You can also configure log sinks to send logs from your projects to aggregators and observability platforms.
Logs can be viewed for all containers in a deployment on the observe page, or you can select an individual container or build in a Northflank service. You can also tail logs using the Northflank API, CLI, and JavaScript client.
View logs
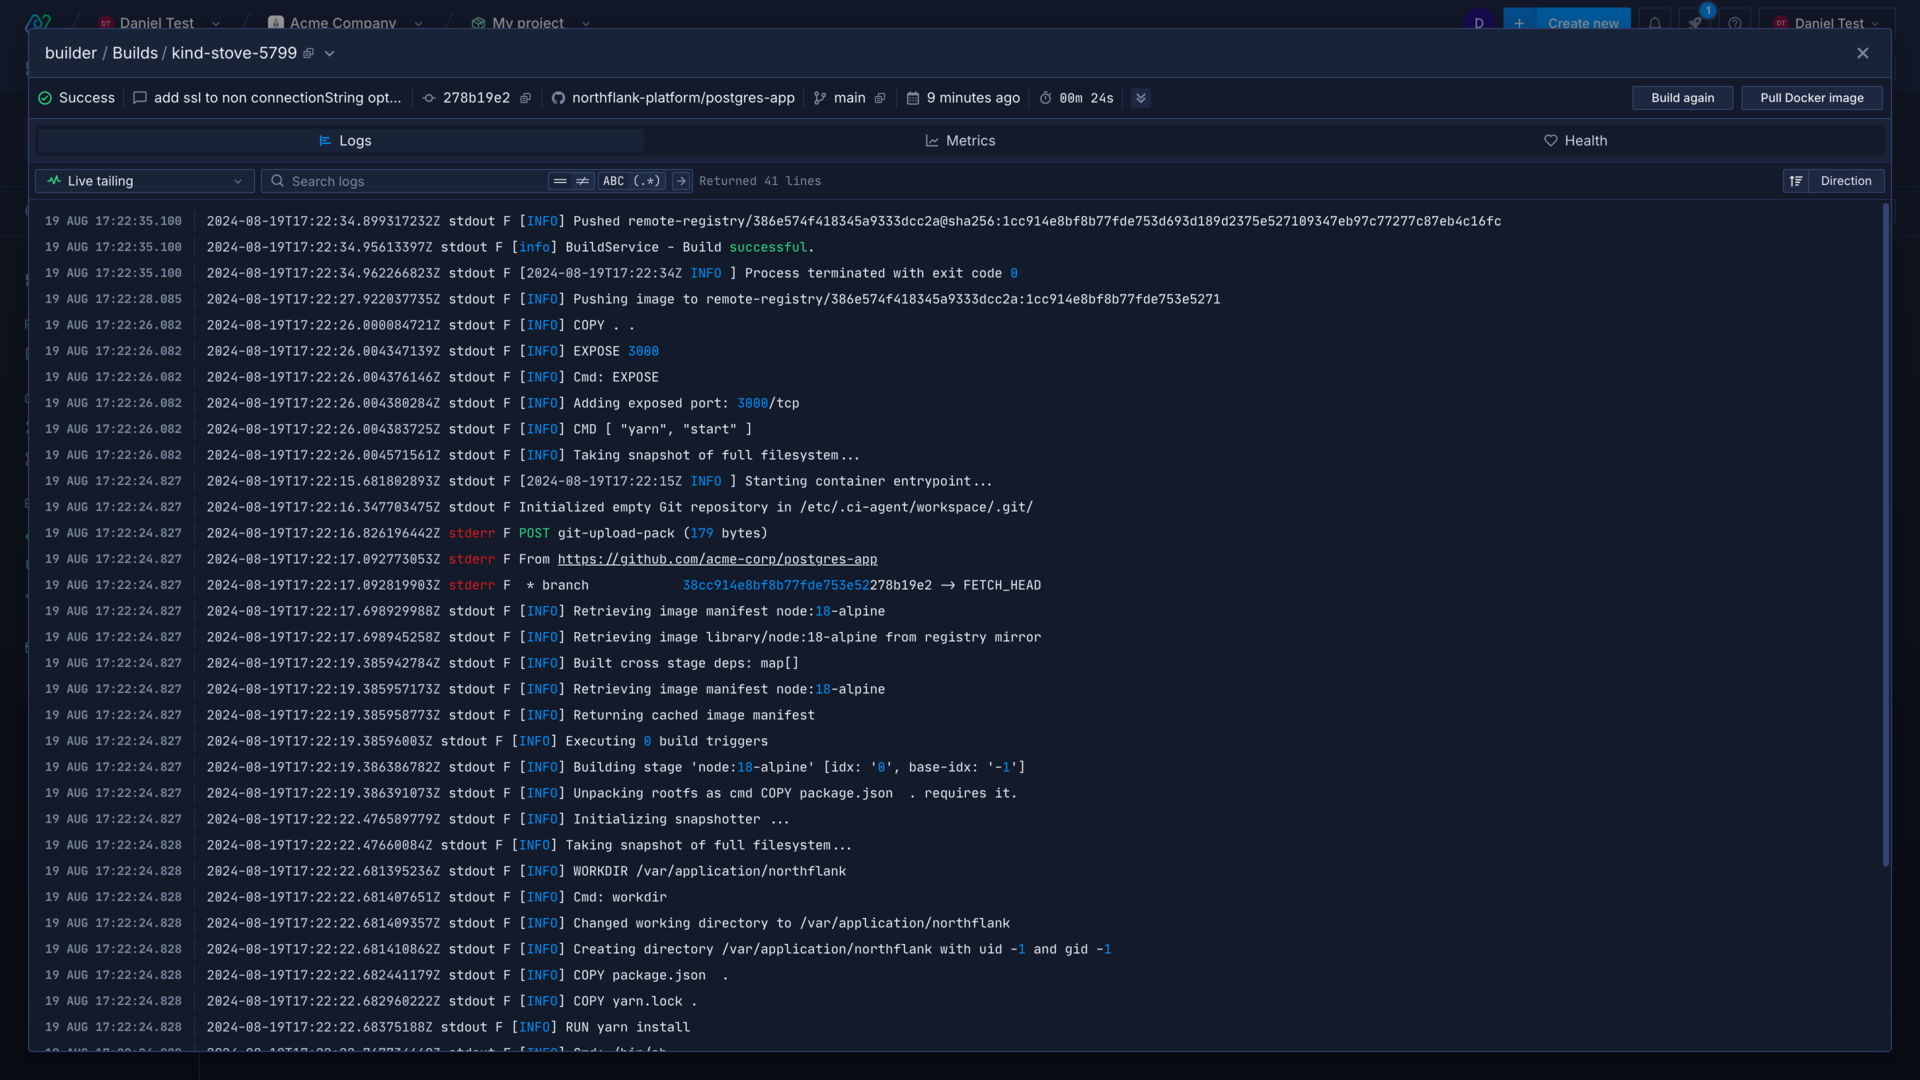
You can view live logs as soon as a build or container is started. Live tailing provides a live feed of the latest log entries, scrolling to the bottom of the logs will load older logs.
Individual container logs can be viewed in:
- a combined or deployment service by selecting an entry from the list of containers for a deployment, on the observe page
- an addon by selecting an entry from the containers list
- a job by selecting an entry from the list of containers for a job run
Build logs can be viewed in:
- a combined or build service by selecting an entry from the builds list
- a job that builds from a repository by selecting an entry from the builds list
Viewing logs across all containers or builds in a service will show logs from:
- running and terminated containers deployed in a service
- CI tracking build progress across parallel builds
- parallel job runs triggered via cron schedule or API trigger
- database masters and replicas
- terminated or running containers (up to 30 days of retention)
Viewing logs from all containers may take a moment to load.
You can use the drop-down menu next to the instance name to select another container to view, or choose to view logs from all containers combined.
The instance header contains contextual information about the build or instance selected. You can open the dropdown menu to view more details.
Search logs
You can open the search menu by clicking search in the top-right of the log window.
You can search log entries by text or regular expression, inclusive or exclusive of the search terms by toggling the options in the search bar. Clicking search or hitting return will display only the logs matching the query.
Search options
==find logs entries that match the entered query!=hide log entries that match the entered queryABCsearch as plain text(.*)search using regex
Example queries
- Searching
example phrasewith==andABCselected will return all log entries that contain the textexample phrase - Searching
warning|errorwith!=and(.*)selected will return all log entries that don't contain the textwarningorerror - Searching
^(?:[0-9]{1,3}\.){3}[0-9]{1,3}$with==and(.*)selected will return all log entries containing a pattern that matches an IP address (e.g.192.168.0.1)
Time range
By default, logs are shown with live tailing. Live tailing provides a live feed of the latest 100 log entries, scrolling to the bottom of the logs will load the next 100 entries.
You can view logs from a specific time range using the dropdown menu, restring the displayed logs to previous hours or days, or a custom time range. Selecting a custom time range will pause live tailing.
You can also reverse the direction so the logs are displayed with the newest entries appearing at the bottom of the log window , or the newest entries appearing at the top of the log window (default).
View mesh logs
Northflank will only display logs from your container's runtime by default. You can also view mesh logs, which include log entries from the Northflank network mesh relevant to the container or containers you are viewing.
You can enable mesh logs from the container logs view, which will populate the log viewer with mesh log entries. You can also disable runtime logs to view only mesh logs.