Once you’ve deployed your code to production, you can use Northflank’s observability tooling and autoscaling to monitor and grow your applications and microservices.
- Logs: access container logs in the application, via the CLI or API, or send to third-party log processors
- Metrics: view detailed metrics for individual containers, or combined metrics for all running containers for a resource
- Shell access: run commands or access an interactive terminal in your running containers
- Notifications: receive notifications for events via different integrations, and configure alerts for your infrastructure and spend
- Autoscaling: enable autoscaling for your services so they can respond to unexpected increases in demand
This guide will help you understand how to monitor and analyse your deployments and storage on Northflank, so you can choose the most suitable method for your project. Each topic provides links to in-depth documentation on the relevant features.
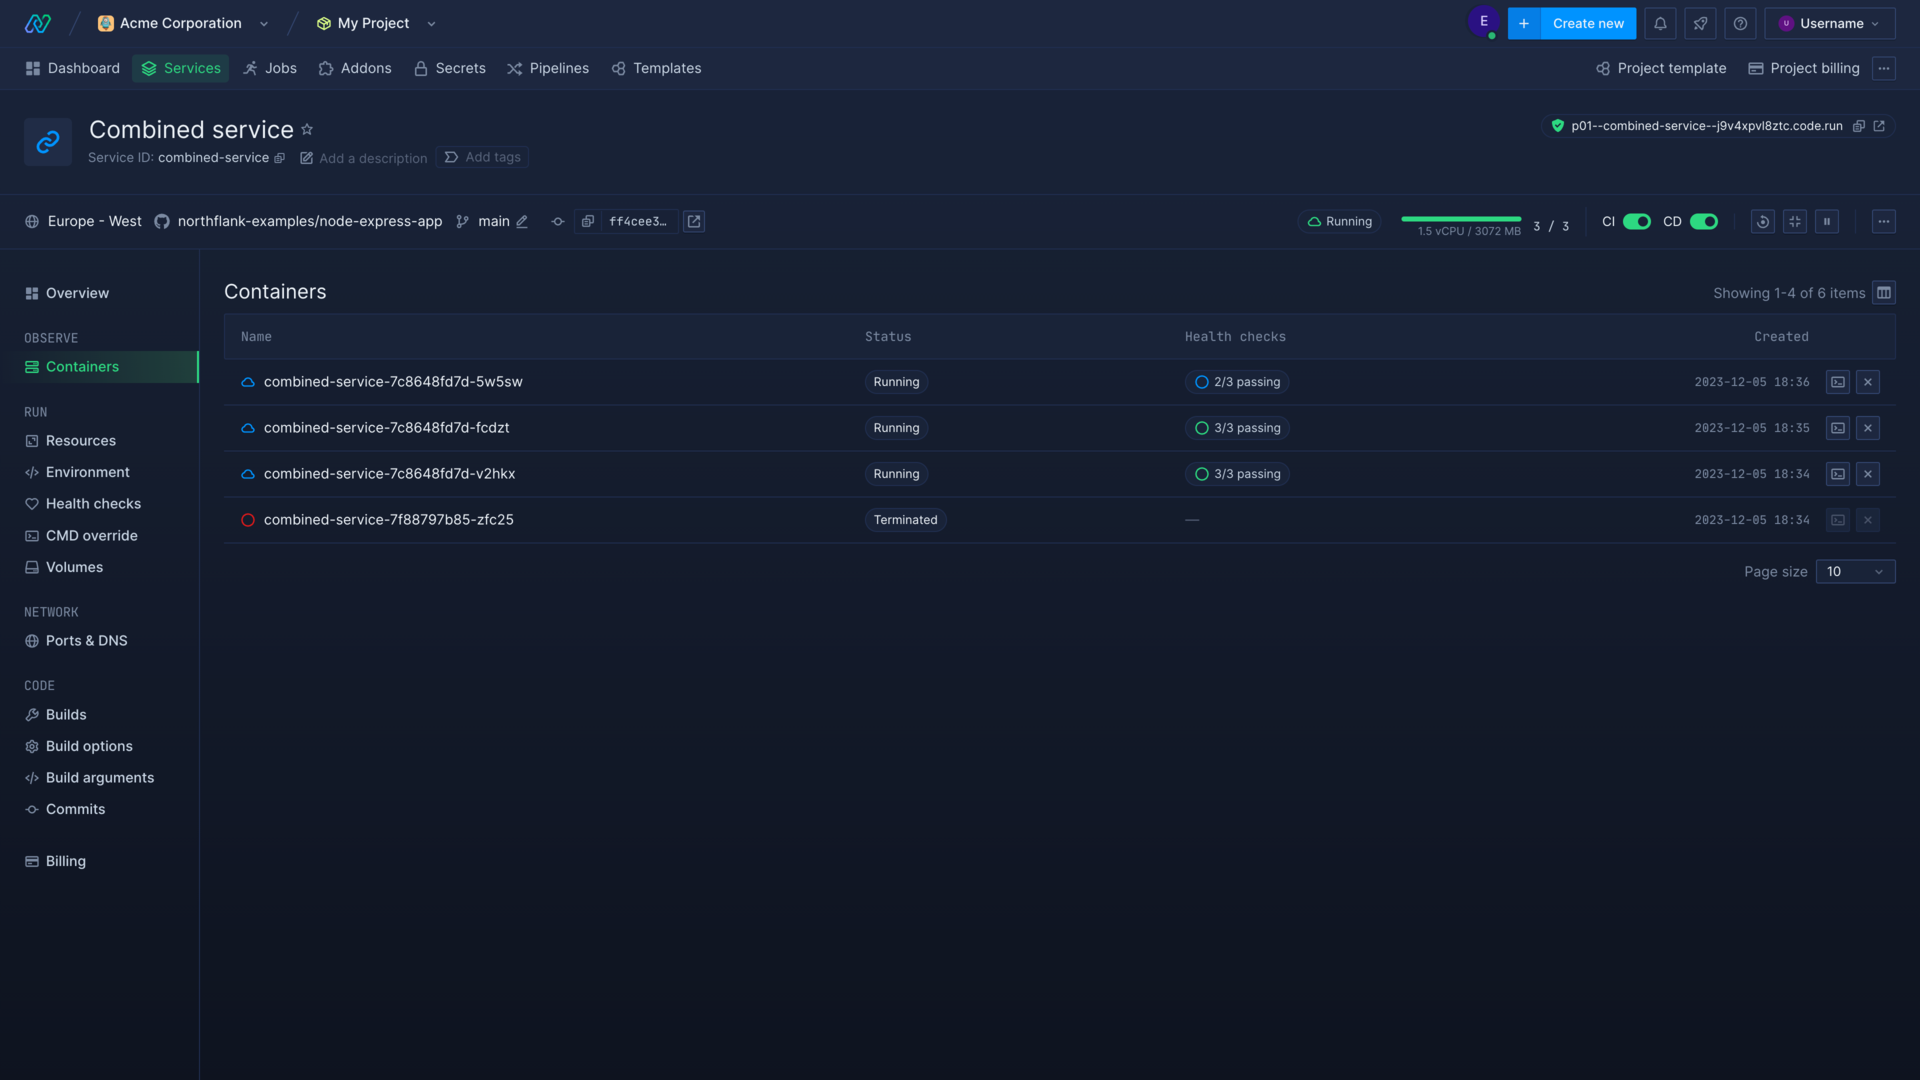
Container view
You can click on a container for a service or job to view logs, metrics, health checks, and gain shell access.
Select the drop-down next to the container name to view another container, or select all containers to view logs and metrics from all containers for the service.
Access container logs
Accessing and searching logs can be vital to ensure your code is running as expected, and to diagnose any issues.
You can click on a container for a service or job in the Northflank application to view logs for that container, or select all containers from the dropdown in the header to view combined logs from all containers for the service.
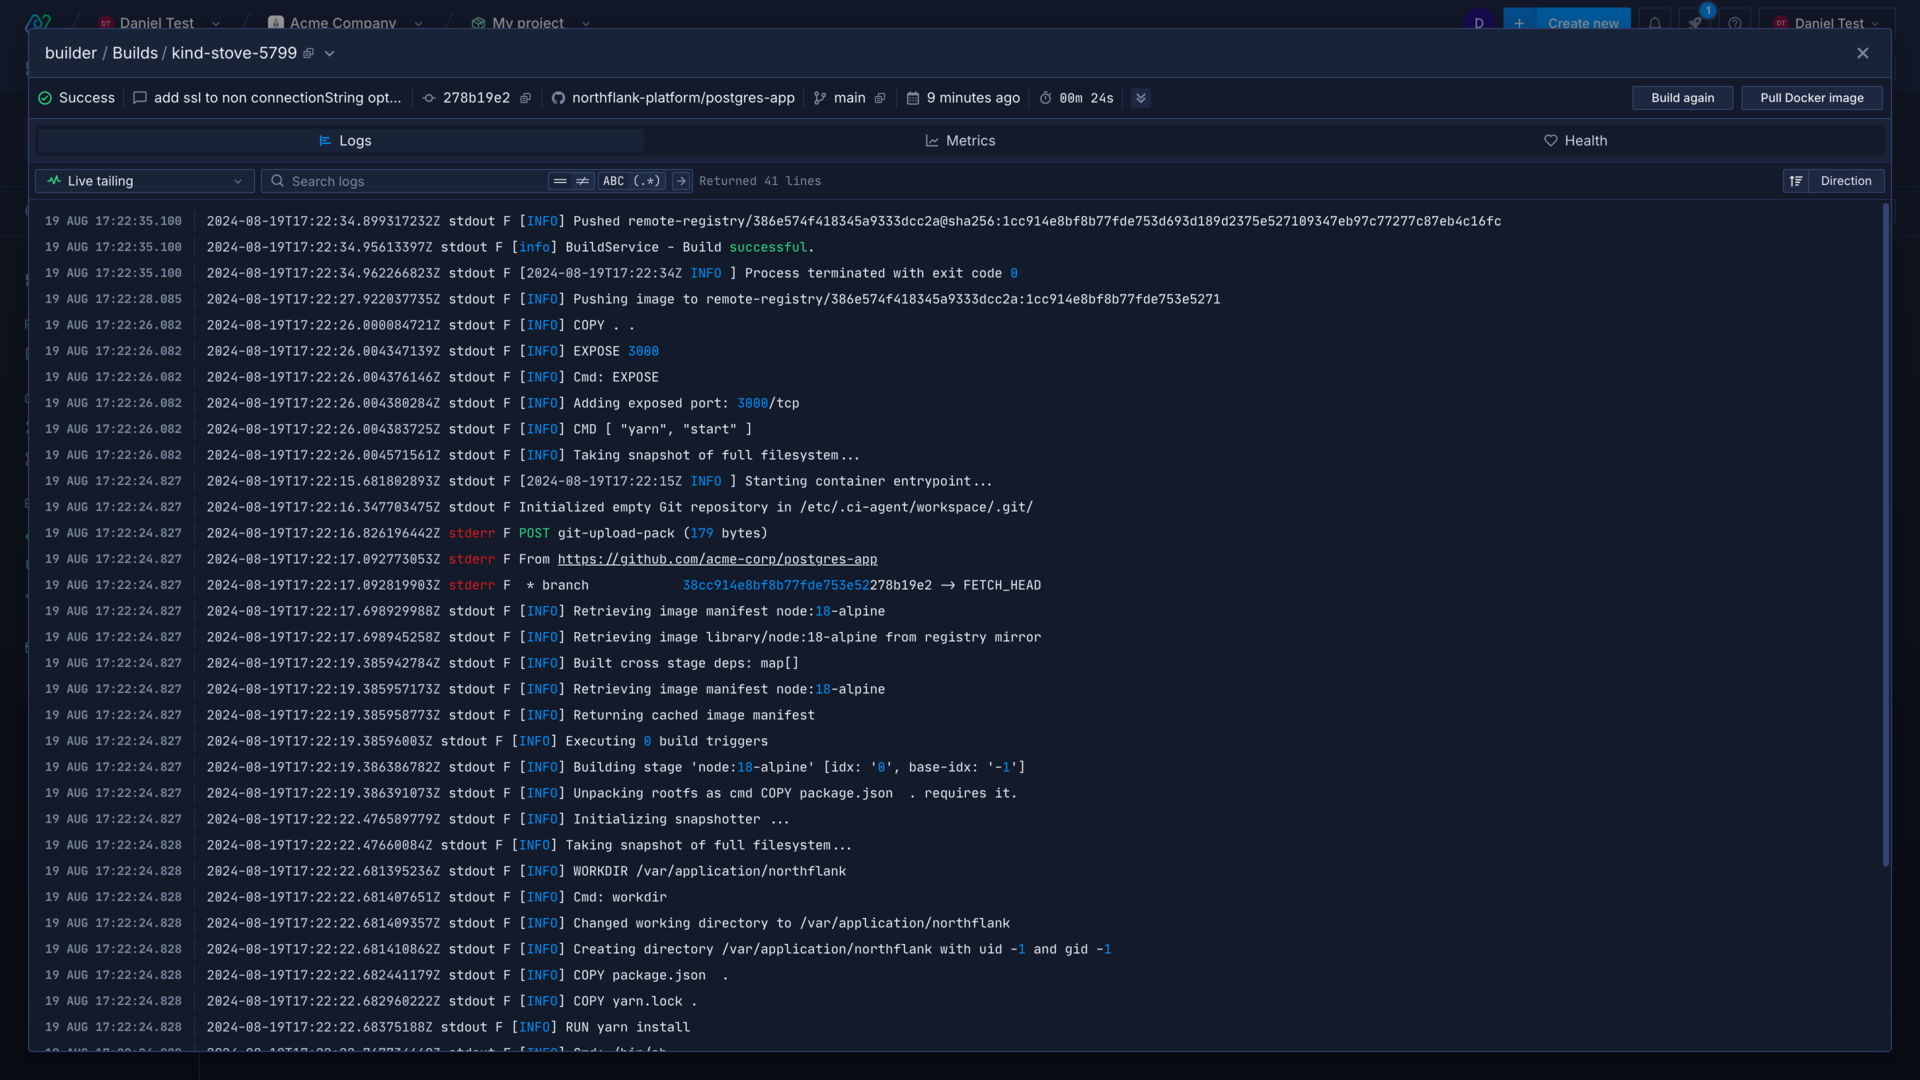
Logs contain all messages produced by your code that output to stdout or stderr and can be searched using plain text or regex. By default logs are shown with live tailing, but you can also select a custom time range using the dropdown menu.
You can also live tail logs using the Northflank CLI, or with the JavaScript Client.
Log sinks
You can configure log sinks to forward logs from your services and jobs to third-party aggregators or external storage. These tools can help you filter and analyse logs, store logs for regulatory purposes, and collect logs from different sources.
Learn more
View container metrics
Metrics can help you interpret the performance of your code, and whether it needs to be optimised in certain aspects, or whether your infrastructure needs to be scaled up.
You can view metrics for an individual container or all your containers for a service in the Northflank application in the same way as logs. You can live tail metrics for a specified time period, or select a custom time range to view metrics from.
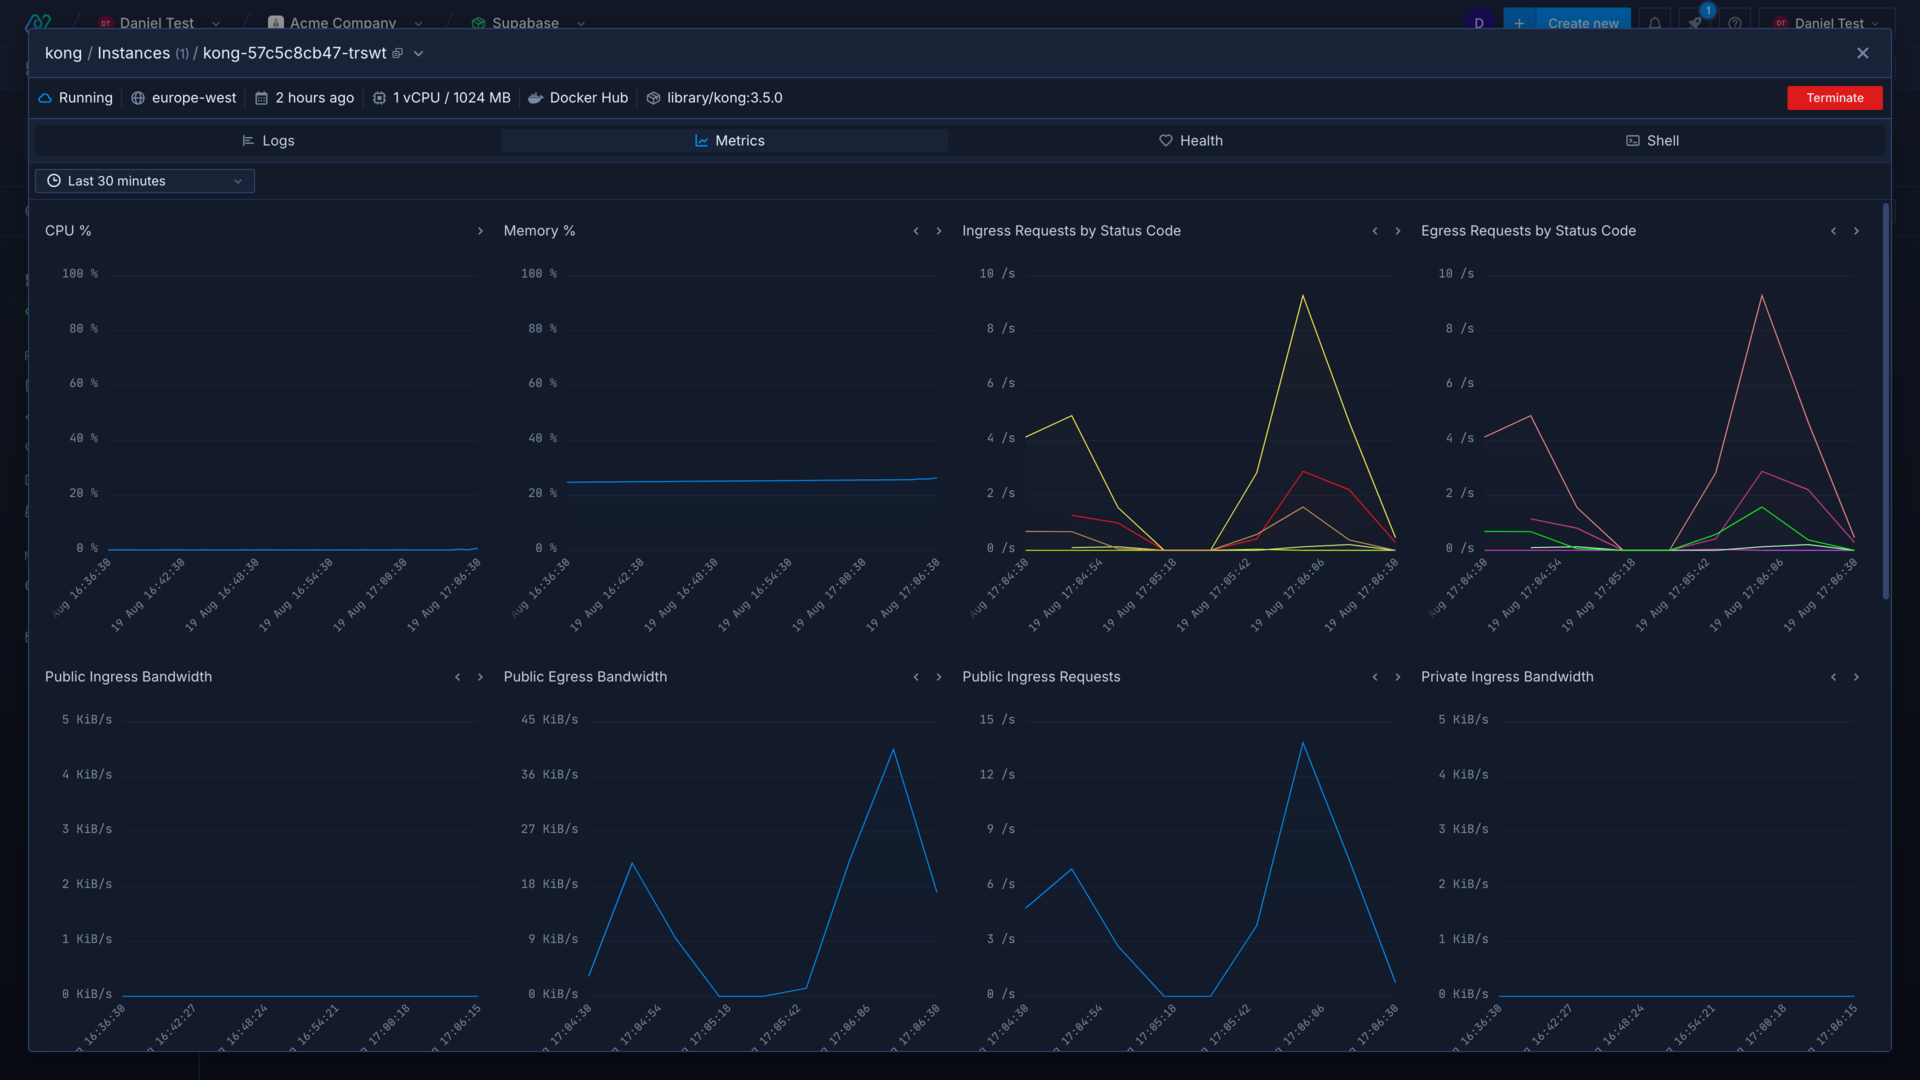
You can also access metrics using the Northflank API.
Learn more
View metrics
View detailed, real-time metrics from builds, deployments, and more.
Scale with Northflank
Increase the resources available to your workloads, and the number of running instances for a deployment.
Networking
Configure public and private ports for your Northflank workloads, and add security with IP policies and basic authentication.
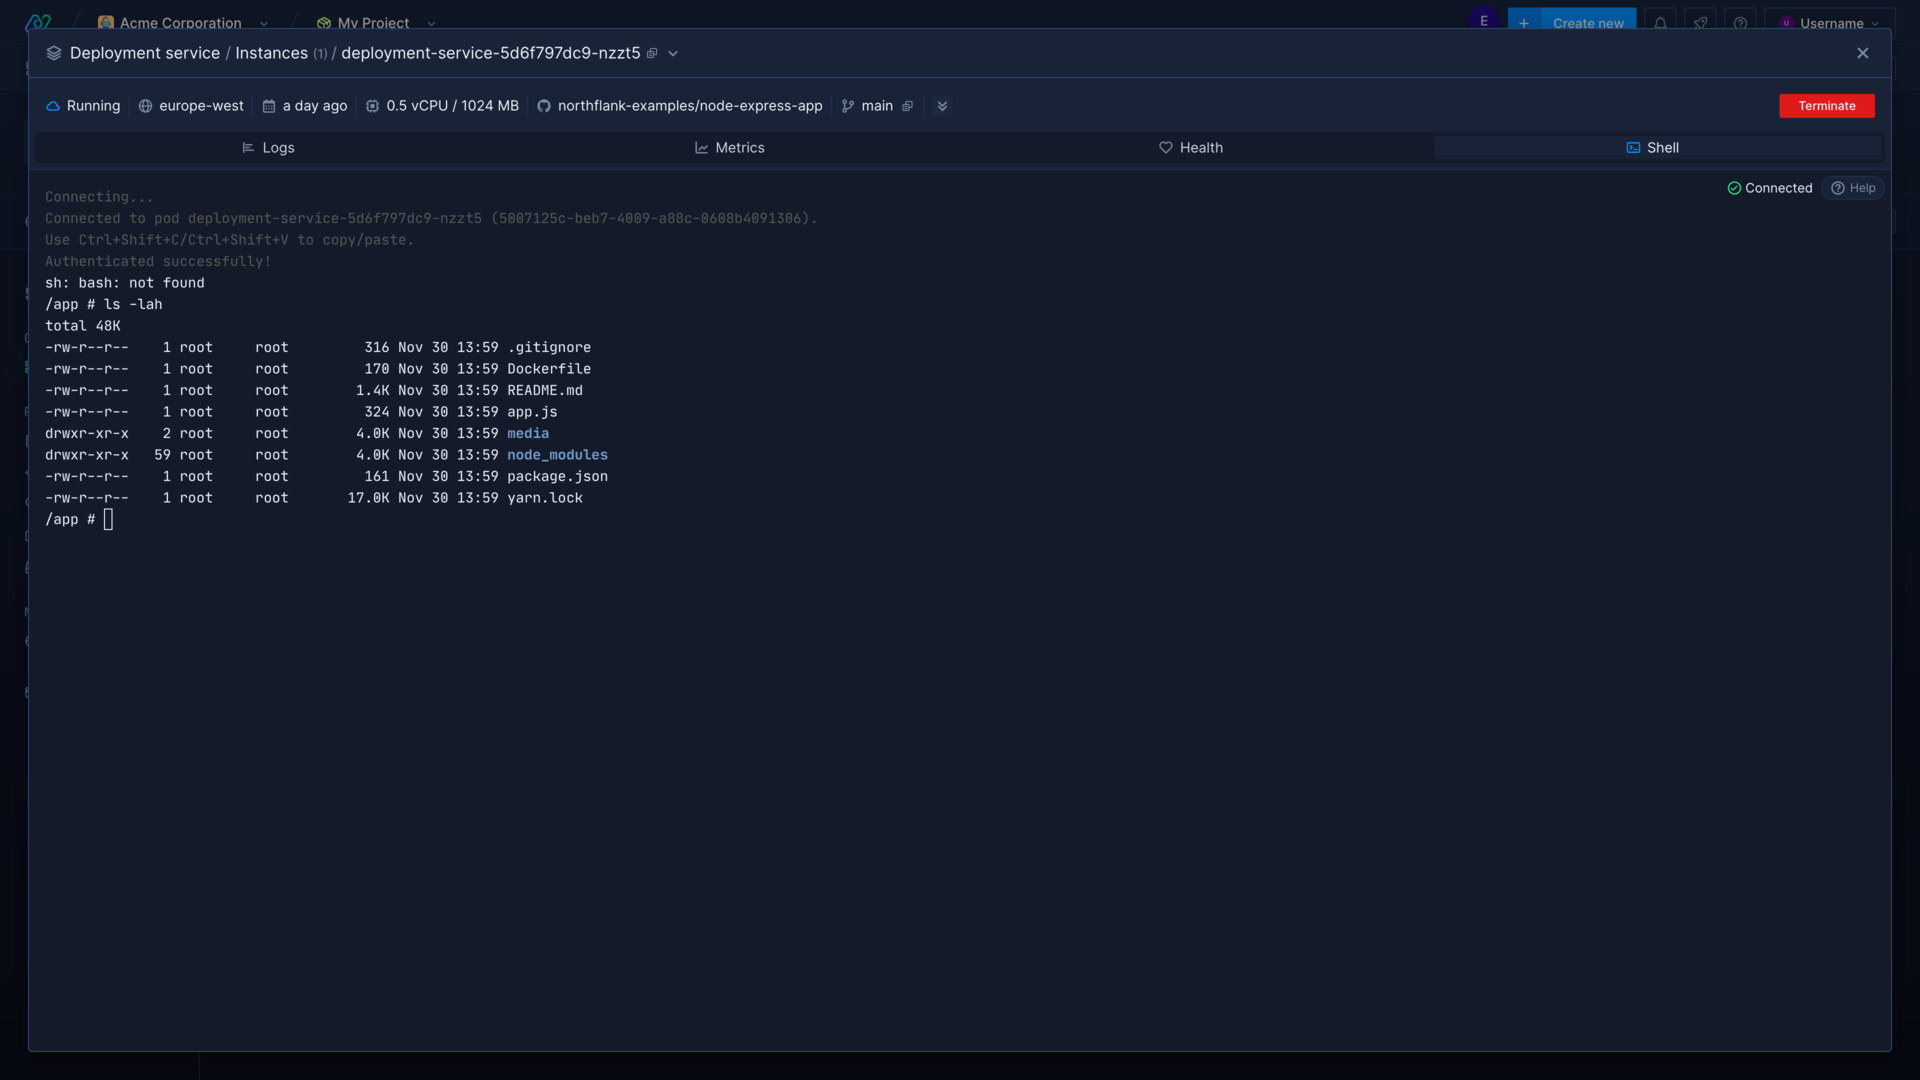
Access running containers
You can access running containers in the container view in the Northflank application using the shell view, which will create a new shell session in the selected container. Only running containers can be accessed, and a shell session can only be created in one specific container at a time.
You will gain full access to the file system in the container, and be able to access any files and run any programs or commands available in the build image.
You can also send commands to be executed in a container for a service using the Northflank API or CLI, or start an interactive shell session in the CLI.
Learn more
Receive notifications
You can create notification integrations to provide alerts to third-party services such as Slack and Discord, or to your own custom webhook endpoint. These integrations can alert you to various events that occur in your Northflank account, or in specific projects, such as the status of an addon backup or build (started, succeeded, failed, or aborted), or updates on a deployment’s status.
You can configure separate notification integrations to send messages about specific events and from specific projects to separate channels. You could configure a notification integration to send all alerts for a project to a specific endpoint (a project alerts Slack channel, for example), or send messages regarding all addon backup events to another channel. You could also create separate notification integrations for specific events in specific projects, for instance all job run notifications for one project might be sent to a dedicated Slack channel.
You can use the webhook endpoint to integrate with your existing services, or third party services, such as an SMS service to alert your on-call engineers if an infrastructure alert is triggered.
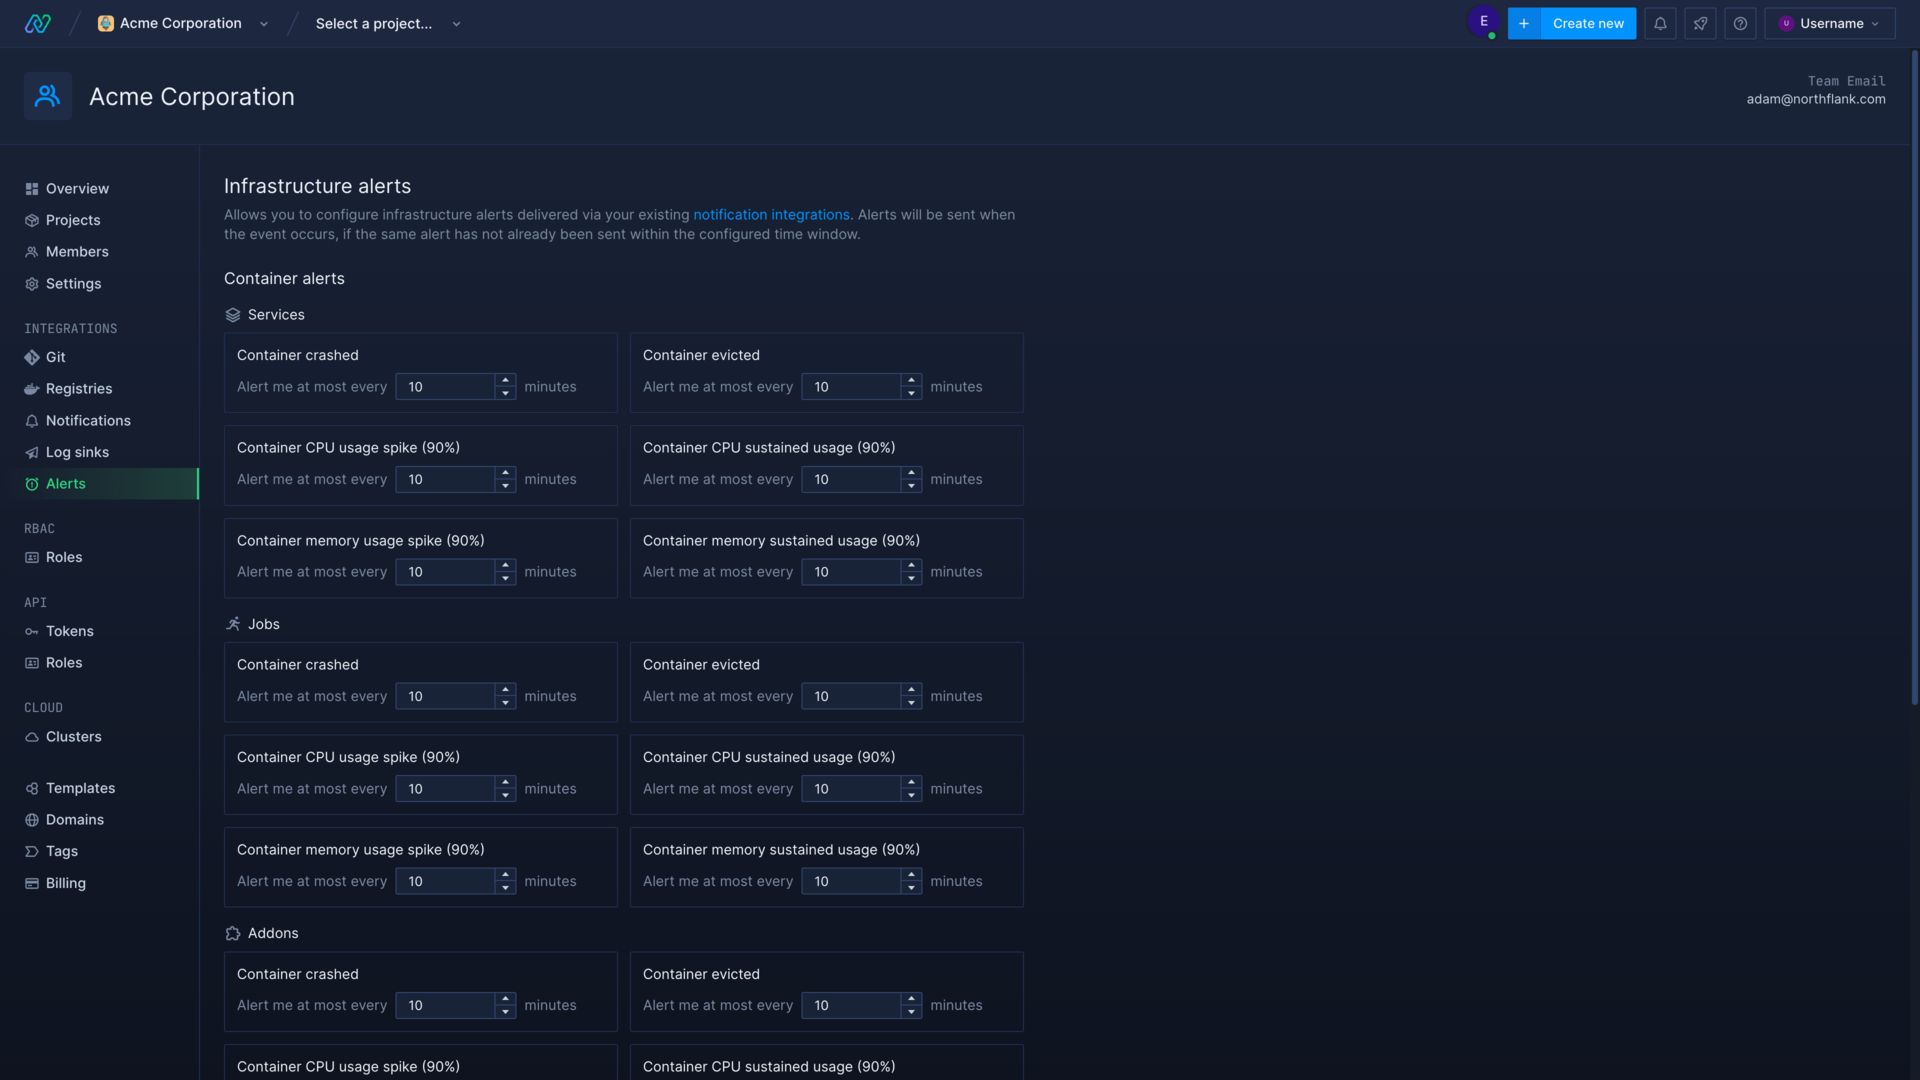
Infrastructure alerts
You can enable infrastructure alerts in a notification integration, which will be triggered by issues affecting your containers or volumes, either by project or across your entire account.
Infrastructure alerts can notify you when, for example, a service container is crashing, which may require intervention to restore your service, or when a database is reaching capacity, which may need to be scaled up to avoid failures.
You can configure the thresholds for infrastructure alerts being triggered in your account, which applies to alerts for all of your resources and all notification integrations. These thresholds ensure events which happen at a high frequency don’t spam your endpoints.
Billing alerts
You can create billing alerts to notify you when your monthly account spend exceeds the given amount. You can create multiple billing alerts to help you keep track of your spend.
For example, if your average monthly usage is $1000, you might create alerts for $250, $500, $750, and $1000. This would help you track if your spend was as projected throughout the month and avoid any surprises, as you would expect to receive the $250 alert after the first week, the $500 alert the next, etc.
Billing alerts will be sent to your account’s invoice delivery addresses by email, and any notification integrations with billing alerts enabled.
Learn more
Receive notifications
Create notification integrations to be alerted when selected events occur in your account.
Infrastructure alerts
Set infrastructure alerts to let you and your team know when there is an issue with your applications or addons.
Monitor spending
Monitor your current resource usage across services.
Set up autoscaling
Autoscaling can help you reduce unnecessary spend on resources you aren't using, while also helping you make sure you can cover any increased activity, expected or not. Rather than trying to anticipate spikes in demand or running more instances than necessary, you can configure your deployments to respond to demand in real-time.
You can configure horizontal autoscaling for your deployments, which can increase or decrease the amount of instances for a service based on demand, from your service's resources page.
You can set your service to autoscale on CPU usage, memory usage, or both, and set the minimum and maximum number of instances that autoscaling will be allowed to scale the service to.
Learn more
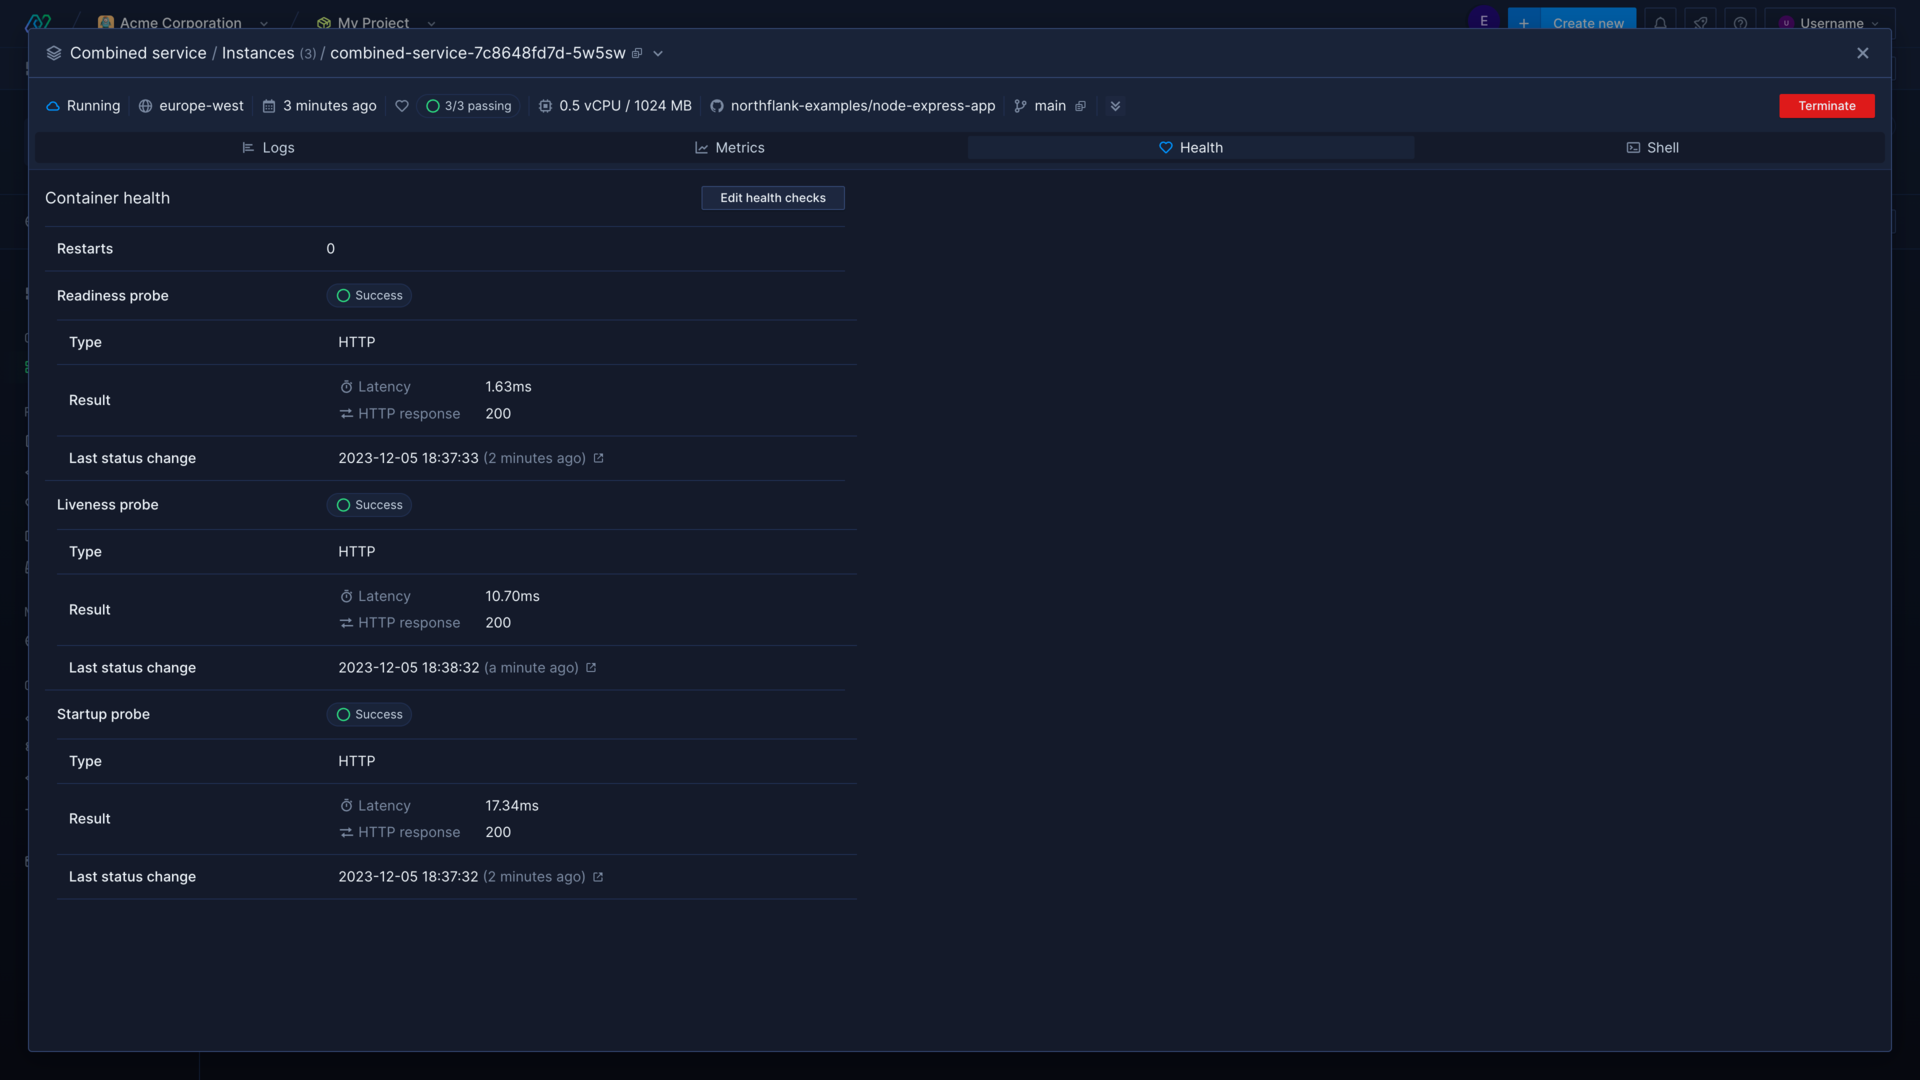
Add health checks
Health checks make sure that your containers are healthy and ready to serve traffic before requests are routed to them, and that any containers that become unhealthy are replaced.
- Liveness probes ensure your running containers remain healthy. A liveness probe will check the given endpoint in intervals to ensure the response is ok. If a liveness probe fails, the failing container will be marked for termination and a new one will be deployed.
- Readiness probes test if a container is ready to receive traffic after initialisation. Until the check passes old containers will not be terminated, and no traffic will be directed to the new container. If the check fails the container will not serve traffic. Configure a liveness probe to replace containers that fail readiness probes.
- Startup probes stop other probes from running until they pass, and enable you to use a different command and different initial delays from your other probes.
You can monitor the status of health checks for individual containers from the container view, and identify any issues that may be causing your containers to crash or restart. Incorrectly configured probes can also cause otherwise healthy containers to be terminated.