Northflank provides access to metrics from builds, deployments, addons, and job runs.
These metrics allow you to analyse builds and deployments to ensure your code is performant and without errors.
Metrics can be viewed for all containers in a deployment on the observe page, or you can select an individual container or build in a Northflank service. You can also retrieve metrics using the Northflank API, CLI, and JavaScript client.
View metrics
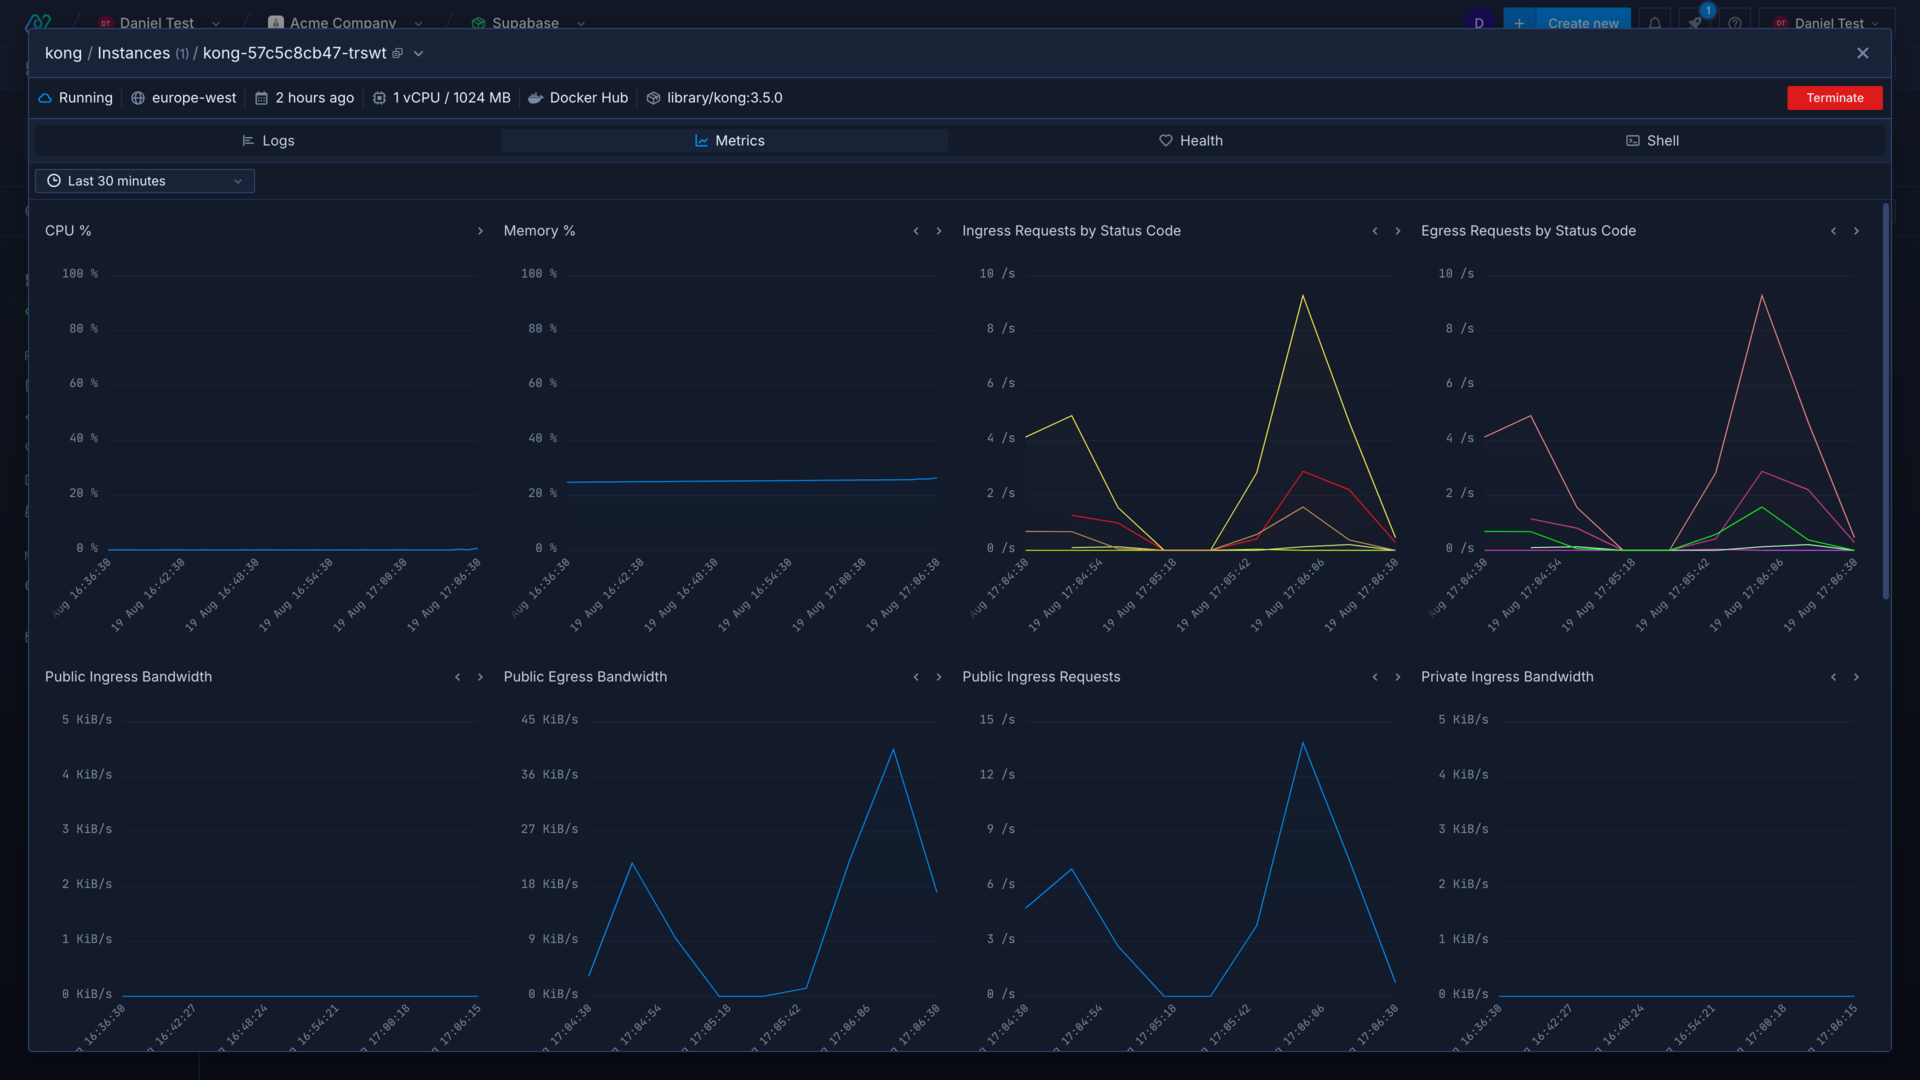
Metrics are collected and displayed on a 15-second scale up until the container's termination. The metrics view live-tails the previous 30 minutes of data by default, you can select another time interval to view, or enter a custom range to see metrics from a precise period.
You can adjust the position of each graph according to your personal preference by moving them right or left .
You can hover over a graph to view more detailed for the metric, for example specific bandwidth values or the different status codes returned for requests.
Individual container metrics can be viewed in:
- a combined or deployment service by selecting an entry from the list of containers for a deployment, on the observe page
- an addon by selecting an entry from the containers list
- a job by selecting an entry from the list of containers for a job run
Build metrics can be viewed in:
- a combined or build service by selecting an entry from the builds list
- a job that builds from a repository by selecting an entry from the builds list
Viewing metrics across all containers or builds in a service will show logs from:
- running and terminated containers deployed in a service
- CI tracking build progress across parallel builds
- parallel job runs triggered via cron schedule or API trigger
- database masters and replicas
Viewing metrics from all containers may take a moment to load.
You can use the drop-down menu next to the instance name to select another container to view, or choose to view logs from all containers combined.
The instance header contains contextual information about the build or instance selected. You can open the dropdown menu to view more details.
Types of metric
The metrics view includes graphs related to container performance and demand. These metrics can help you investigate various issues with your services. For example, if you see a lot of 5xx responses you may have a problem in your application, or the server may be overloaded if you also see a spike in network requests.
Resources
You can view the CPU and memory usage for containers, which can help you identify bottlenecks or issues with your code. For example, you may notice CPU and memory usage spiking with increased traffic, which means you could increase the resources available to your containers, add more instances, or enable autoscaling to resolve it.
If your CPU and memory usage continues to increase, despite increasing the resources, it may indicate a problem with your code.
The volume capacity graph shows the usage of any persistent volumes associated with a service or addon. Only services with a persistent volume will display this graph, and addons will show the volume usage for the selected replica.
Networking
Networking metrics are available for containers which consist of public and private requests and bandwidth, by ingress and egress. Bandwidth metrics and requests by status code are aggregated from all containers, ingress and egress requests values are for individual containers.
Public network statistics include traffic to and from external sources, which reach your service via your service's public endpoints.
Private network statistics include traffic to and from sources from within the same project via your service's private ports, from other Northflank projects through multi-project networking, Tailscale devices, and securely-forwarded ports.
Logs
Log lines displays the number of logs generated per second, aggregated from all containers.
Next steps
View logs
View detailed, real-time logs from builds, deployments, and more.
Configure health checks
Monitor the uptime and success of your deployed services and builds to ensure your code runs correctly and is always available.
Scale your services
Increase the resources available to your services, and the number of instances to deploy.
Expose a deployment's port
Configure ports and security for your deployments.